:::: DecisionPoint Weekly Wrap -- Break and Bounce :::: By Carl Swenlin | May 20, 2017
In our Conclusions section of the Weekly Wrap last week, I expressed my heightened level of caution due to the negative condition of our indicators. On Monday a nice rally to new, all-time highs gave me cause to doubt my assessment, but the rally stalled on Tuesday, and the bottom fell out on Wednesday. But never mind, the market bounced off Thursday's low, and about half of the loss was recovered by Friday's close. Will Thursday's low be retested, or has another up leg begun? Let's look at the technicals and see if they can give us a clue as to what may happen next.
STOCKS
IT Trend Model: BUY as of 11/15/2016
LT Trend Model: BUY as of 4/1/2016
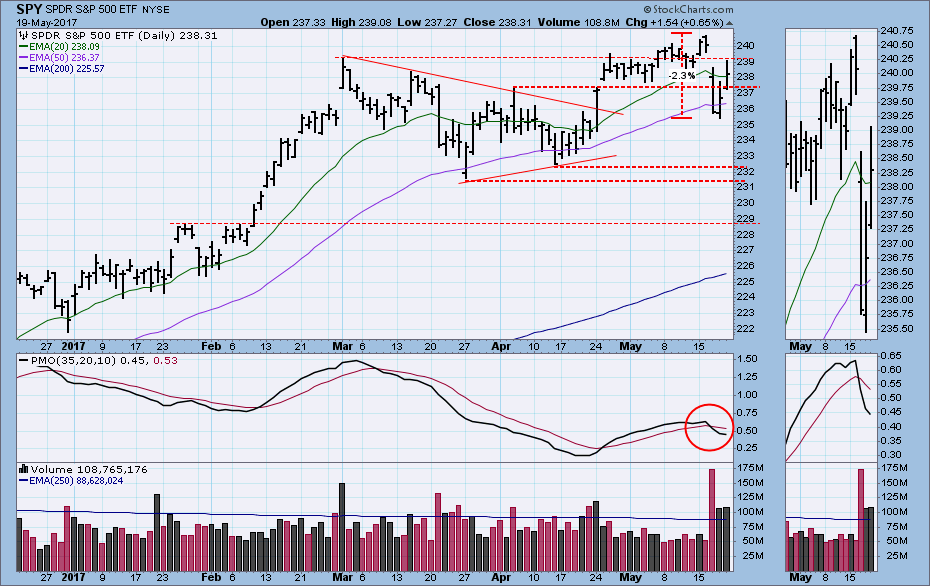
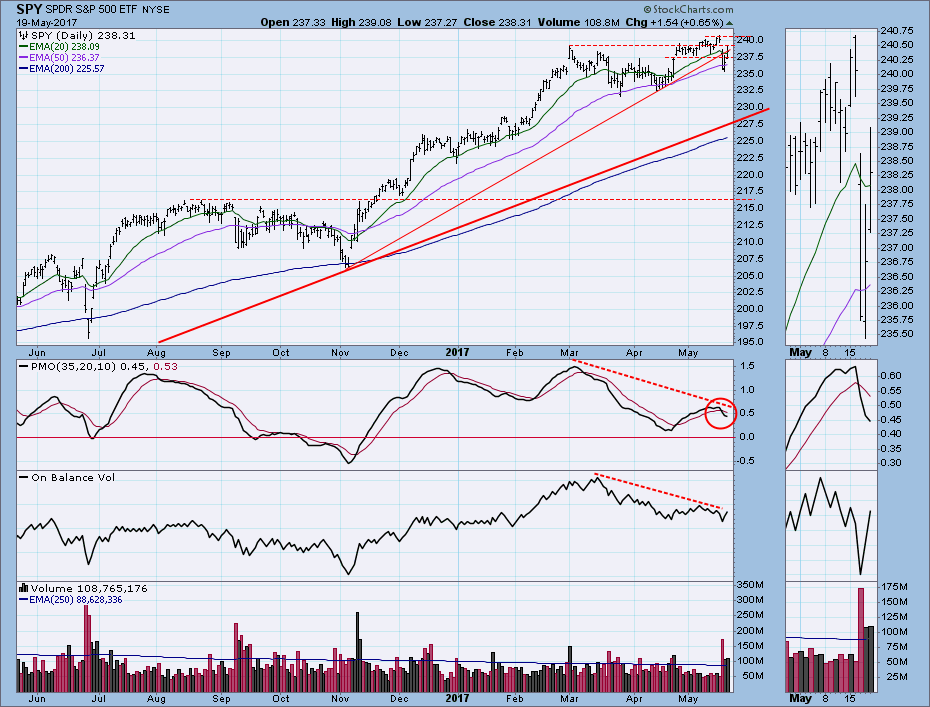
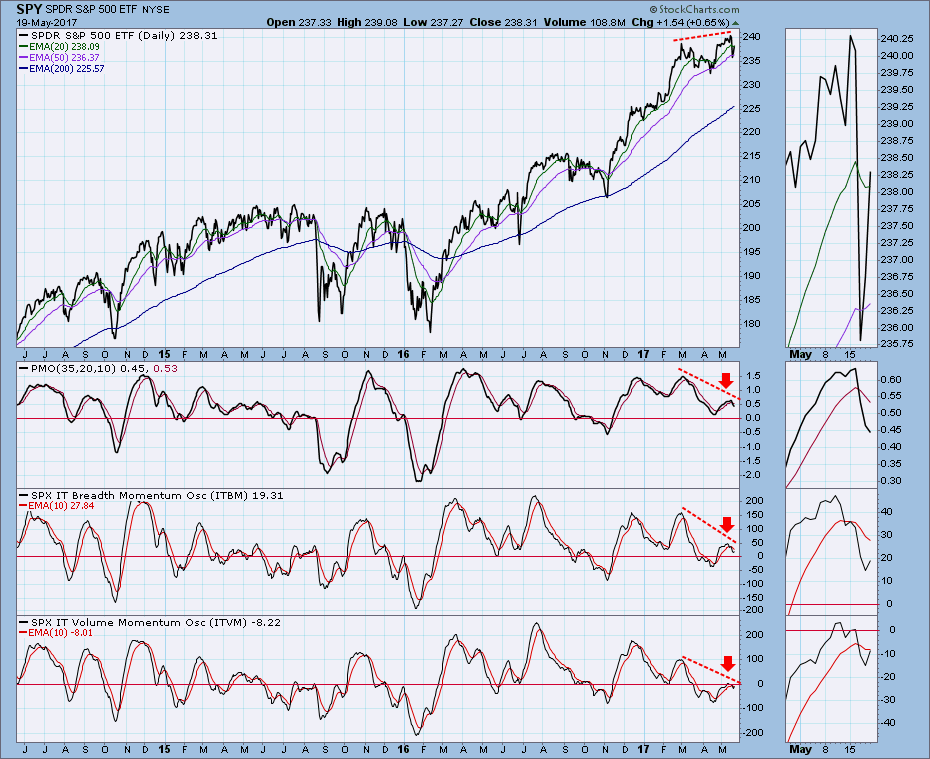
First, I must point out that the total decline from Tuesday's all-time high was a mere -2.3%. Granted, Wednesday was somewhat dramatic, but it hardly justified all the headless chickens and spontaneously combusting hair. Put in the perspective of the one-year daily chart below, we can see that price is still substantially above the longer-term rising trend line. (The origin of that trend line is made clear on the weekly chart.) My expectation is that price will move back to that line eventually, but I don't have a road map. The steeper trend line drawn from the November price low was violated this week, so the line is no longer relevant. PMO and OBV negative divergences still exist. Friday was options expiration day, so do not consider Friday's high volume to be a demonstration of confidence in the rally.
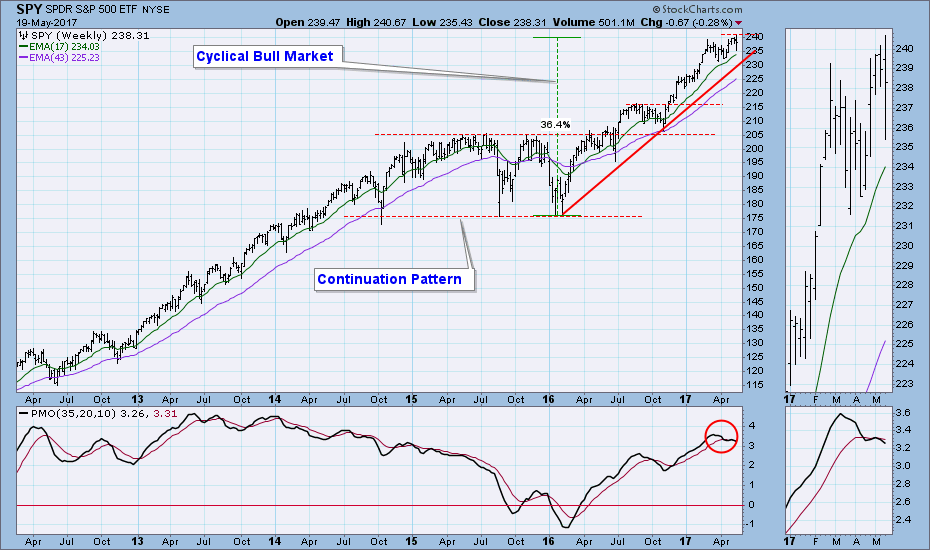
The weekly chart shows that price is gradually moving back toward the primary rising trend line drawn from the 2016 low. A strong negative is that the weekly PMO (Price Momentum Oscillator) is declining below its signal line.
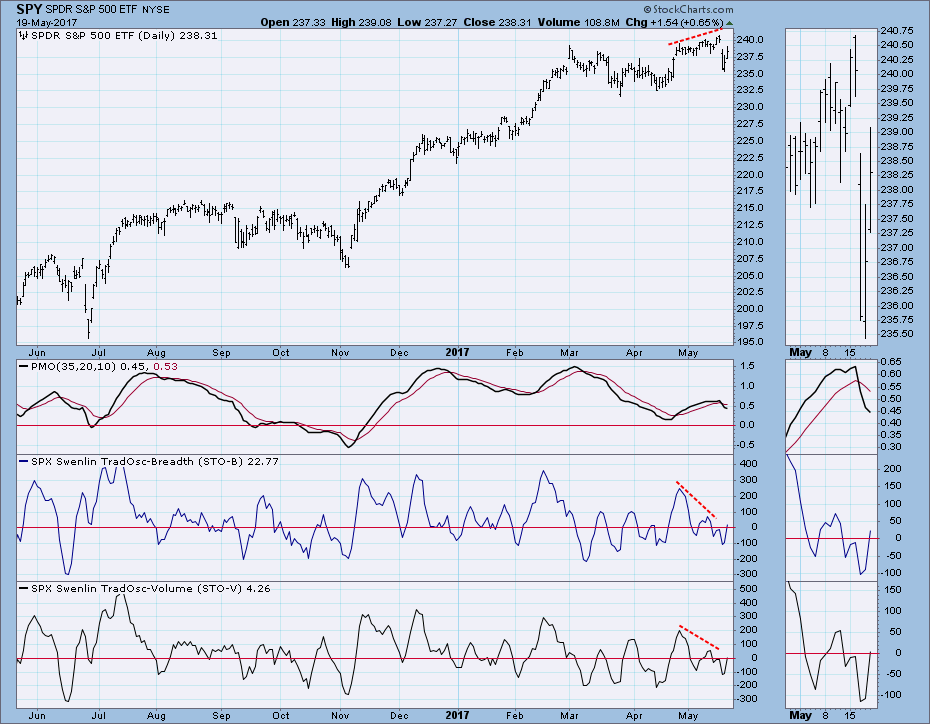
Short-Term Market Indicators: The negative divergences shown are actually no longer operative because their warning has been fulfilled by this week's decline. Now those indicators are rising from oversold levels, and will accommodate higher prices in this time frame. We should note, however, that quick reversals have been commonplace as of late.
Intermediate-Term Market Indicators: Like the short-term indicators, these indicators have experienced quick reversals -- I count six on the ITBM in the last two weeks. Assuming that prices continue higher, it will be a while before they become overbought. The negative divergences in this time frame are still operative, even though the ITBM and ITVM are rising.
Conclusion: We are in an intermediate-term and long-term bull market, and I don't think we are seeing a major top forming here. Someday that top will come, but, until I see serious technical damage being done, I am going to assume that the bull will prevail. I will be thinking the same way when the top actually arrives, and I will have to adjust my outlook as the market rolls over and proves me wrong. That being said, I am not convinced that the current correction is over. I don't rule that out, but I think that a little more work needs to be done on the downside.
Click on "In reply to", for Authors past commentaries
Information posted to this board is not meant to suggest any specific action, but to point out the technical signs that can help our readers make their own specific decisions. Your Due Dilegence is a must! • DiscoverGold
Register for free to join our community of investors and share your ideas. You will also get access to streaming quotes, interactive charts, trades, portfolio, live options flow and more tools.


 News
News  Market Data
  Discover