


| Followers | 679 |
| Posts | 140715 |
| Boards Moderated | 37 |
| Alias Born | 03/10/2004 |
Saturday, May 20, 2017 9:06:36 AM
CoT: Peek Into Future Through Futures — How Hedge Funds Are Positioned
By Hedgopia | May 20, 2017
Following futures positions of non-commercials are as of May 16, 2017.
E-mini S&P 500: Currently net long 32.1k, down 52.9k.
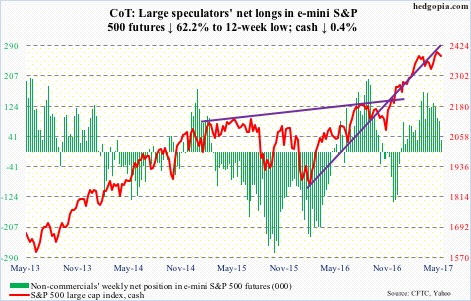
Bulls’ inability to convincingly take out 2400 continued, but at the same time dip buyers have not given up. A day after notching a new intraday high of 2405.77, the cash (2381.73) dropped 1.8 percent on Wednesday.
Bulls needed to save 2325, or 2280 in a worse-case scenario. The latter is where a rising trend line from February last year rests. A must-save! Those levels were not even tested. From the Thursday low, the S&P 500 rallied 1.2 percent.
That said, medium-term, both weekly and monthly conditions are in overbought territory and are probably itching to go lower. The 50-day is beginning to flatten out.
Last July, the S&P 500 had a major breakout at 2120, followed by a successful retest pre-election.
Amidst all this, flows are struggling. In the week to Wednesday, SPY, the SPDR S&P 500 ETF, lost $2.2 billion (courtesy of ETF.com). In the past three, $8.6 billion has been redeemed.
Ditto with U.S.-based equity funds, which lost $1.2 billion in that week – $7 billion in the last three (courtesy of Lipper).
Incidentally, foreigners of late have been a tailwind for U.S. stocks. In the 12 months to March, they purchased $47.1 billion worth. In February last year, they were selling as much as $142 billion worth – a record. The last to jump on the rally train?
Nasdaq 100 index (mini): Currently net long 78.5k, down 15.9k.
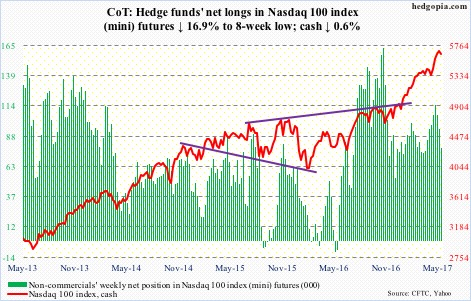
In the week ended Wednesday, QQQ, the PowerShares Nasdaq 100 ETF, experienced redemptions every day, to the tune of $728 million (courtesy of ETF.com). The Nasdaq 100 (5651.56) went on to score a fresh high (5724.71) on Tuesday.
Too soon to say if Wednesday’s 2.5-percent drop is the beginning of something big. Momentum is yet to break. The last time it traded below its 50-day (5493.36) was early December last year.
That said, the prevailing rally is primarily led by the heavy-weights. Medium- to long-term, risk/reward dynamics probably favor the former. The week produced a spinning top candle. First layer of decent support lies at 5450.
Russell 2000 mini-index: Currently net short 43.9k, up 3.8k.
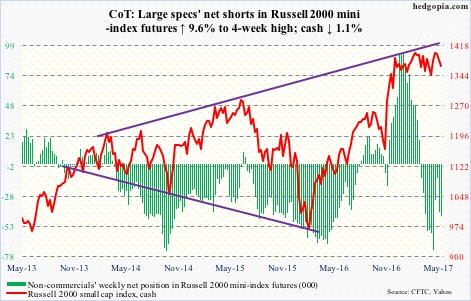
After defending the 50-day several times in the prior nine sessions, the cash (1367.33) sliced through the average on Wednesday when it deflated 2.8 percent. Intraday Thursday, it came close to testing the bottom of the 1390s-1340s range, which has been intact for over five months now, before finding support.
The daily chart is oversold. What transpires at the 50-day (1377.74) – or even at/near range top – will be a big tell as to how things may trend next. Medium- to long-term, risk is to the downside.
In the week ended Wednesday, IWM, the iShares Russell 2000 ETF, lost $1.2 billion. In the prior week, an equal amount was withdrawn (courtesy of ETF.com).
US Dollar Index: Currently net long 34.3k, down 1.5k.
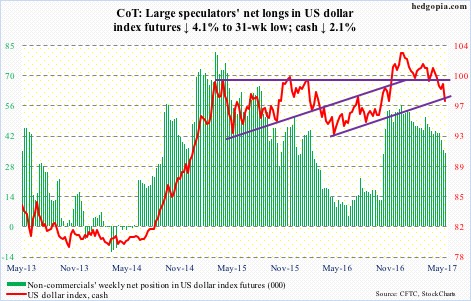
The cash (97.03) is on pace for three straight monthly decline – and four out of five. It peaked early January this year at 103.82 after breaking out of resistance at 100.70, which goes back to March 2015. Turns out it was a false breakout. The dollar index has lost that support, as well as a rising trend line from last May.
It is oversold, but needs to stabilize. Resistance lies at 98.6, and the 200-day (99.12) after that.
VIX: Currently net short 142.4k, up 26.7k.
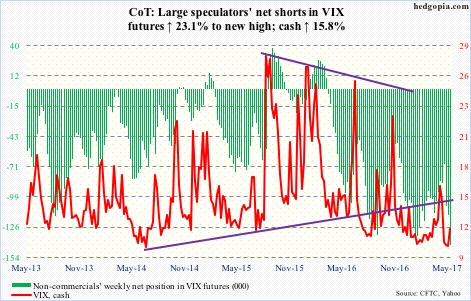
From an intraday low of 9.56 on May 9 to a high of 15.71 on May 18, the cash (12.04) exploded higher Wednesday but only to give back most of those gains by Friday.
Non-commercials likely played a role in Wednesday’s 46.4-percent surge in the cash as they had built most net shorts by Tuesday.
In the past, reversals following similar spikes have resulted in volatility contraction. The 200-day (12.87) was lost as quickly as it was recaptured. Ditto with the 50-day (12.16).
Down the road, a golden cross – potentially bullish for volatility – is possible. Less than a point separates the two, even as VIX continues to linger around the bottom of its multi-year range.
http://www.hedgopia.com/cot-peek-into-future-through-futures-how-hedge-funds-are-positioned/
• DiscoverGold
Click on "In reply to", for Authors past commentaries
Information posted to this board is not meant to suggest any specific action, but to point out the technical signs that can help our readers make their own specific decisions. Your Due Dilegence is a must!
• DiscoverGold
Join the InvestorsHub Community
Register for free to join our community of investors and share your ideas. You will also get access to streaming quotes, interactive charts, trades, portfolio, live options flow and more tools.

