


Friday, May 05, 2017 10:07:06 AM
Everything suggests more near-term weakness but for a couple oscillators being oversold and the volume being relatively high. However, those oscillators aren't really a positive in my mind until we try and emerge from them. And the volume rose a second consecutive down day, suggesting strength in a move down.
I'm sticking with sideways at best and more near-term weakening as most likely.
There was one AH buy of 100 shares for $0.79, 16.19% above the close, at 19:38. This is exactly the sort of trade I've seen in the past that appeared to be a manipulative trade.
There were no pre-market trades.
B/a just before open was 1K:500 $0.7100/84.
09:30-09:55 opened the day with a 426 buy for $0.7350 & $0.72 x 500, x 317, x 183. Then came 9:31's 100 $0.71, 9:32's 700 $0.71, 9:33's 100 $0.71. The following were all 100-200 share minutes at $0.71: 9:34, 9:35, 9:36, 9:37, 9:38, 9:39, 9:40. Then came 9:41's 12.5K $0.7100 (2.7K)/16 (9.7K)/20 100, 9:42's 100 $0.7016, 9:43's 500 $0.7016/21/16/21, 9:44's 600 $0.7021 (200)/16, 9:45's b/a 100:1.2K $0.7016/$0.7297. The following all did 100-300 share one-minute $0.7016: 9:45-:50. Then came 9:51's 600 $0.7116 (200)/15, 9:52's1.6K $0.7015/12/00 (1.4K), 9:53's 7.8K $0.7000/1 (3.8K)/0 (3.8K)/0, 9:54's 300 $0.7009/10/00, and the period ended on 9:55's 200 $0.70.
09:56-10:20 began variable volume $0.70/$0.7104 on 9:56's 3.3K $0.7025/40 (3K)/00. B/a at 9:56 was 3.7K:1.6K $0.7050/$0.7286.
B/a at 10:02 was 2.9K:1.6K $0.7051/$0.7286. The period ended on 10:20's 3.5K $0.7010 (200)/00.
10:21-10:45 began mostly low/medium-volume $0.6900/7 on 10:21's 6.4K $0.70 (2.8K)/$0.6901/6/9 (2.1K)/01/06/10/50/08. B/a at 10:23 was 15K:800 $0.6900/9, 10:32 8.3K:1.3K $0.6900/7 (offers jiggling 07/08), 31.6K:2.6K $0.6900/94. The period ended on 10:45's 10.3K $0.6997 (10K blk)/00.
10:46-11:38 began an initially low/medium-volume rise, before falling, on 10:46's 300 $0.69. 10:51's 400 hit $0.691/3, 10:54's 9.6K hit $0.6910/48. B/a at 11:02 was 2.5K:2.9K $0.6920/45. 11:06's 3.4K $0.6900/1 began the fall. Volume was interrupted by 11:09's 21.4K $0.6900 (incl $0.69 20K blk). B/a at 11:18 was 400:3.7K $0.6902/99, 11:33 60:4.2K $0.6902/79 (bids backed by presented 32.8K $0.69). The period ended on 11:38's 26.3K $0.6900 (incl $0.69 24.5K blk)/3 (100).
11:39-12:40 began extremely low/no-volume $0.6810/95, on 11:39's 7.3K $0.6900 (5.7K)/$0.6850 (1.1K)/23, before beginning a rise on 11:43's 20K $0.6810/57 and hitting 11:47's 2.6K $0.6850/95. B/a at 11:49 was 1K:3.2K $0.6810/90, 12:02 500:300 $0.6860/89. 12:03's 8.1K hit $0.6889/$0.70. 12:19 11.1K:2.5K $0.6850/92, 12:33 11.6K:500 $0.6850/99. The period ended on 12:40's 3K $0.6895.
12:41-13:12 began an extremely low/no-volume decline from $0.6895, after 12:43's 53.7K, 9.4% of day's volume $0.6800 (14K blk)/50 (10K blk)/00 (20.3K in "larger trades")/10/50/00/50/10/00/01/10/00/10/58/50/01. B/a at 12:50 was 24.3K:1.6K $0.6800/98, 13:04 23.1K:3.5K 6800/47. The period ended on 13:12's 300 $0.68.
13:13-14:08 began mostly extremely low/no-volume $0.68/$0.6938, with falling highs, on 13:13's 8.2K $0.6800/50/26. B/a at 13:17 was 2.4K:8.7K $0.6900/99, 13:31 19.7K:1.6K $0.6800/$0.6949. Volume was interrupted by 13:42's 21.3K $0.68/9. B/a at 13:54 was 14.6K:5.4K $0.6800/93. Volume was interrupted by 13:59's 13.3K $0.6801/$0.69/$0.6822. B/a at 14:06 was 12.4K:3.8K $0.6800/99. The period ended on 14:08's 700 $0.6800.
14:09-14:25 began a drop through 14:12 on 14:09's 11.8K $0.68 (11.7K)/$0.6750 (100). 14:11's 10.4K hit $0.6739/50 and 14:12's 2K hit $0.6702/39. That began extremely low-volume $0.6707/12. B/a at 14:14 was 500:100 $0.6701/12, 14:17 500:100 $0.6701/9. The period ended on 14:25's 200 $0.672.
14:26-15:49 began extremely low/no-volume $0.67/$0.6898, with slowly rising lows and slowly falling highs, on 14:26's 7K $0.6720 (800)/$0.70/$0.68 (5.5K). B/a at 14:32 was 800:300 $0.6802/98, 14:45 1.7K:500 $0.6894, 15:02 800:1K $0.6720/$0.6893, 15:17 12.5K:2.7K $0.6720/$0.6805 (offers falling rapidly), 15:32 11.5K:2K $0.6720/49, 15:47 1.8K:800 $0.6730/4. The period ended on 15:49's 500 $0.673.
15:50-15:59 began low/medium-volume $0.6720/$0.6825 on 15:49's 500 $0.6730. B/a at 15:56 was 10/5K:400 $0.6720/$0.69, 15:59 9.7K:500 $0.6720/99. The day and period ended on 15:59's 3.5K $0.6736 (1K)/20/$0.6810/$0.6720/$0.6810/$0.6720 (1.2K)/$0.6799, the official close because there was no 16:00 MM closing trade.
There was one AH buy of 100 shares for $0.79, 16.19% above the close, at 19:38. This is exactly the sort of trade I've seen in the past that appeared to be a manipulative trade.
Excluding the opening and closing trades (didn't qualify), there were 25 larger trades (>=5K) totaling 220,883, 36.20% of day's volume, with a $0.6876 VWAP. For the volume the count seems reasonable. The percentage of day's volume seems high though. However, that may be an effect of share price. With price below $0.70 I may need to kick the cut-off size up to around 10K with possible larger trades going to ... 8K? 9K?
There were enough "larger larger trades", that typically are "behind the curtain" inter/intra-broker trades, that the true shorting activity may be "masked".
The VWAP was marginally higher than the day's $0.6873. I can't imagine who would be taking these shares other than shorters and MMs doing covering buys. But there's also the possibility that price/volume alerts got triggered and we have some retailers buying. With the price dropping intra-day almost continuously the prices would be attractive to everyone of those folks I guess.
Who was selling? I'm stuck right where I've been for a few days now - DJ hitting the ATM, along with shorters recognizing an opportunity, seems the most likely to me. We'll never know though.
Check the buy percentage in the first period! I've seen it worse, but that's very rare. Note that even as price fell "precipitously", the buy percentage made little headway. It's obvious that someone was hammering shares into the market, just as we've seen the last few days, as evidenced by the prior four days maxing out at ~37%. Needless to say, the ending buy percentage is disgusting.Ending Period Period Period __Per. Trade_ Period_ % Day_ Per. End
Period Volume Low High _Dollar Val._ VWAP___ Volume Buy ~%
09:55 29126 $0.7000 $0.7350 $20,493.84 $0.7036 4.77% 1.46% Incl 09:41 $0.7016 9,700
10:20 45760 $0.7000 $0.7104 $32,175.22 $0.7031 7.50% 16.59% Incl 10:13 $0.7000 6,455
10:45 78179 $0.6900 $0.7000 $54,081.06 $0.6918 12.82% 18.85% Incl 10:33 $0.6900 4,000 10:43 $0.6901 8,700
10:45 $0.6997 10,000
11:38 105562 $0.6900 $0.6976 $72,879.71 $0.6904 17.31% 13.04% Incl 10:53 $0.6910 13,000 11:09 $0.6900 20,000
11:38 $0.6900 24,540
12:40 70272 $0.6810 $0.7000 $48,217.85 $0.6862 11.52% 18.38% Incl 11:42 $0.6810 4,900 $0.6821 7,000
11:43 $0.6810 15,000 11:57 $0.6851 5,000
12:17 $0.6881 7,000
13:12 73553 $0.6800 $0.6900 $50,179.93 $0.6822 12.06% 18.21% Incl 12:43 $0.6800 4,000 5,000 6,288 14,000
12:43 $0.6850 10,000 12:44 $0.6898 4,300
14:08 87700 $0.6800 $0.6999 $60,208.45 $0.6865 14.38% 24.34% Incl 13:22 $0.6900 10,400 13:42 6,300
13:42 $0.6900 10,000
14:25 36204 $0.6702 $0.6800 $24,439.77 $0.6751 5.94% 25.54% Incl 14:11 $0.6750 5,000
15:49 58670 $0.6700 $0.7000 $39,694.73 $0.6766 9.62% 24.79% Incl 14:26 $0.6800 5,300 15:23 $0.6745 5,000
15:59 21372 $0.6720 $0.6825 $14,402.31 $0.6739 3.50% 24.51%
19:38 100 $0.7900 $0.7900 $79.00 $0.7900 0.02% 24.53%
On the traditional TA front, movements were:
Discussing the possibility of bottoming yesterday as we touched $0.70, I said { With the touch of $0.70, my proposed support point, it may be time to re-consider. }__Open_ ___Low_ __High_ _Close_ Volume_
Today 2.08% -4.29% -2.00% -5.56% 42.44%
Prior 1.41% -1.41% 3.96% 0.26% 55.14%
I'm sure glad I didn't!
On my minimal chart, the most significant thing is we blew right through the $0.70 potential support that held yesterday. We did it on volume rising for the second consecutive day. The day's high stopped exactly, AFAICT, on the medium-term ascending resistance (former support, rising orange line). The day's low stopped just 1 cent above the 12/30/16 all-time low of $0.66.
Volume is problematic here. Relative to generally recent volumes today's might have been big enough to signal the drop is near over (again?!). However, it's also rising for the second consecutive day, suggesting increasing strength in the move lower.
Since tomorrow is Friday, I wouldn't be surprised to see much lower volume (which I expected today - silly me) and a generally flattish price behavior. But with what we've seen recently I couldn't say what the chances are we'll see that.
The reason is I've come to believe we're seeing the use of the ATM and if it's not over neither is the drop in price.
We continue "pushing" the lower experimental 13-period Bollinger band limit for the fifth consecutive day, not a good sign. Trading range was again completely, and substantially, below the falling mid-point, $0.8044.
Both the fast and slow EMAs continue to decline with the fast below the slow. The gap from the slow down to the fast is now $0.0389 (was $0.0267).
On my one-year chart, for the fifth consecutive day, trading range was completely below all SMAs, all of which are falling with the 10-day below the 50-day SMA. The 20-day is still above the 50-day, but I still think that won't last long.
Yesterday the oscillators I watch had weakening in accumulation/distribution (and by an unusually large magnitude) and momentum. Improvement occurred in RSI (marginally), MFI (untrusted by me), Williams %R (still oversold), full stochastic (still oversold), and ADX-related.
Today had weakening in every oscillator. Each one is below neutral. Oversold are RSI, Williams %R and full stochastic.
The experimental 13-period Bollinger limits, $0.6879 and $0.8044 ($0.7044 and $0.8063 yesterday), continued diverging as both limits declined, the lower faster than the upper. The mid-point is falling.
All in, yesterday I said { the conventional stuff is rotating to a positive near-term prognostication. My intra-day breakdown's buy percentages and VWAP behavior are not supportive of that though. The $0.70 support behavior tomorrow will be a critical factor, along with the volume, which I suspect will weaken, unless there's a large price movement, based on what I saw in the intra-day behavior. }
Looks right on all counts - had a large price movement, accounting for the rising volume, my unconventional stuff argued with the conventional stuff and won, and the $0.70 was critical as once through it we went down -4.29% for the intra-day low and -2.87% for the close.
Only the volume and the oversold conditions could be possibly considered as a bullish indication. However, as mentioned above, the volume is rising for the second day and may not be a relatively high enough level to suggest the bottom is in. I'll be looking for a reducing volume. We might see it tomorrow, but tomorrow is Friday and so we can't really give it the same weight we might on other days.
I'm going with a move to at least touch $0.66, but for that AH trade I mentioned. If that really was a manipulation trade I guess we could see price hold so that more shares can be sold ATM, which I believe accounts for the recent price behavior.
Percentages for daily short sales and buys moved in the same direction, normal and good, and the short percentage went down to the low end of my desired range (needs re-check). There were enough "larger larger trades", that typically are "behind the curtain" inter/intra-broker trades, that the true shorting activity may be "masked", so maybe we can't rely on that today.
Unfortunately the buy percentage went to a level strongly suggestive of more near-term weakness.
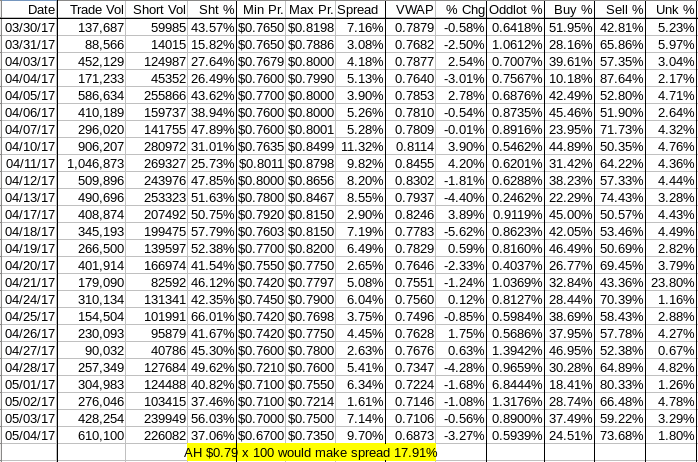
The spread moved to a range strongly suggestive of more near-term downside. If we used the AH $0.79 trade as the high it would be 17.91% - even worse. In past times when such a spread was seen (don't know if they were more manipulative AH trades), the near-term was down.
The VWAP's rolling average of the last twenty-four movements held steady at 15 negatives and 9 positives. Change since 03/30 is -$0.1006, -12.77%, -10.34%, and the averages of the rolling 24-day period seen in the last few days (latest first) are now -0.5319%, -0.4198%, -0.2739%, -0.1888%, -0.1311%, 0.1088%, 0.0842%, -0.2035%, -0.1687%, and -0.0279%.
All in, only the short percentage, which is suspect today, currently suggests things may improve shortly. So I think near-term weakness and a challenge of $0.66 seem most likely.
Bill
Join the InvestorsHub Community
Register for free to join our community of investors and share your ideas. You will also get access to streaming quotes, interactive charts, trades, portfolio, live options flow and more tools.

