 News
News  Market Data
  Discover
Support: 888-992-3836
Copyright © 2023 InvestorsHub Inc.


CIO, SignalPoint Asset Management, 2008 to 2024, Retired
OldAIMGuy
![]()
CIO, SignalPoint Asset Management, 2008 to 2024, Retired
Register for free to join our community of investors and share your ideas. You will also get access to streaming quotes, interactive charts, trades, portfolio, live options flow and more tools.
Register for free to join our community of investors and share your ideas. You will also get access to streaming quotes, interactive charts, trades, portfolio, live options flow and more tools.
CIO, SignalPoint Asset Management, 2008 to 2024, Retired
Hi EU, Re: TSLA moves......................
Here's TSLA share price ratio'd to Ford for the last three years.
https://schrts.co/HmFzJEuW
Maybe there's a way to trade them as a paired set? Right now that might suggest selling some Ford shares and adding to the TSLA share pile. Then, wait for the trends to reverse and shuffle TSLA shares out and add to the F position. The F side hands out a ~5% yield while you wait.
They're not perfectly paired since they both belong to the same industry, but it looks like some possibilities.
https://stockcharts.com/freecharts/perf.php?TSLA,F&n=821&O=011000
Maybe play then like a Slinkie. One is up and shift some of the slinkie from one hand to the other. Then let the Slinkie handle them in the opposite direction. Average yield if each position was 50% to start would be nearly 2.5%. Let one's good days help pay for the other's bad days.
Whaddya think?
Best wishes,
OAG Tom
Hi JD, Re: v-Wave and its current signal...........................
The Index trimming we've seen in the last week shows just how much a surprise event can
affect a market that was showing signs of risk stress already. Note that RISK didn't get worse
because of the tensions, it relaxed a bit as share prices declined. Value Line's P/E dropped
nicely along with the index declines. It's "Appreciation Potential" improved as the markets
gave back some of their recent gains. That improved our v-Wave's current outlook. It's not
yet back to bargain levels seen in late 2022 so keep some powder dry.

Best wishes,
OAG Tom
Hi Jon and Thanks!,
For those of you who don't know JDerb, he was kind enough to take over the v-Wave updates for me back in around 2008 when I joined my partners in forming an investment advisory. Another AIM user, MinstrilMan, also helped out during the transition. Compliance reasons kept me from that and posting here for quite a while. I had to keep a bit lower profile for those reasons.
Jon has been steadfast in keeping us all up-to-date all this time and deserves a round of applause from us all!
Best wishes,
OAG Tom
Hi Adam, Re: AAPL and AIM.......................
My own AAPL position has AIM triggers at $150 on the buy side and $206 on the Sell side. Those are for 10% of Portf Control size orders.
It appears our AIM engines are tuned to similar signals.
Best wishes,
OAG Tom
Before Missiles Flew
Advance/Decline started down.
Spring Rally's end, or???
Hi Will, Re: v-Wave and "Timing....."
While the v-Wave wasn't built for being a 'timing' device, it could offer some insight that way. The problem becomes the length of time for these cycles. How long can we await a 'better time" to be starting an investment? If nothing else, the v-Wave offers some caution right now if one starts a new AIM engine with the suggested starting cash held in reserve.
Best wishes,
OAG Tom
Good morning JD, Re: v-Wave current status..............
The bothersome shorter term 18 Month view isn't very encouraging.
Another Market Risk Indicator I follow shows three components rising in risk this week with two in their Caution range, one in Neutral and one in Proactive. Overall, it's in its 4th week out of the last 6 of being in its own Caution range with risk expanding this last week.
Even if I didn't turn on the TV News, I'd be feeling a bit cautious about starting any new positions at this point. There were better times in the Past and will again arrive in the Future for new AIM engines.
Best wishes,
OAG
Thanks Steve, Re: Eclipse.....................
We didn't get the same view from SE Wisconsin......
Best wishes,
OAG
Somebody spilled Red Ink all over my portfolio holdings today!!!
(not enough to generate any AIM trades, however)
OAG
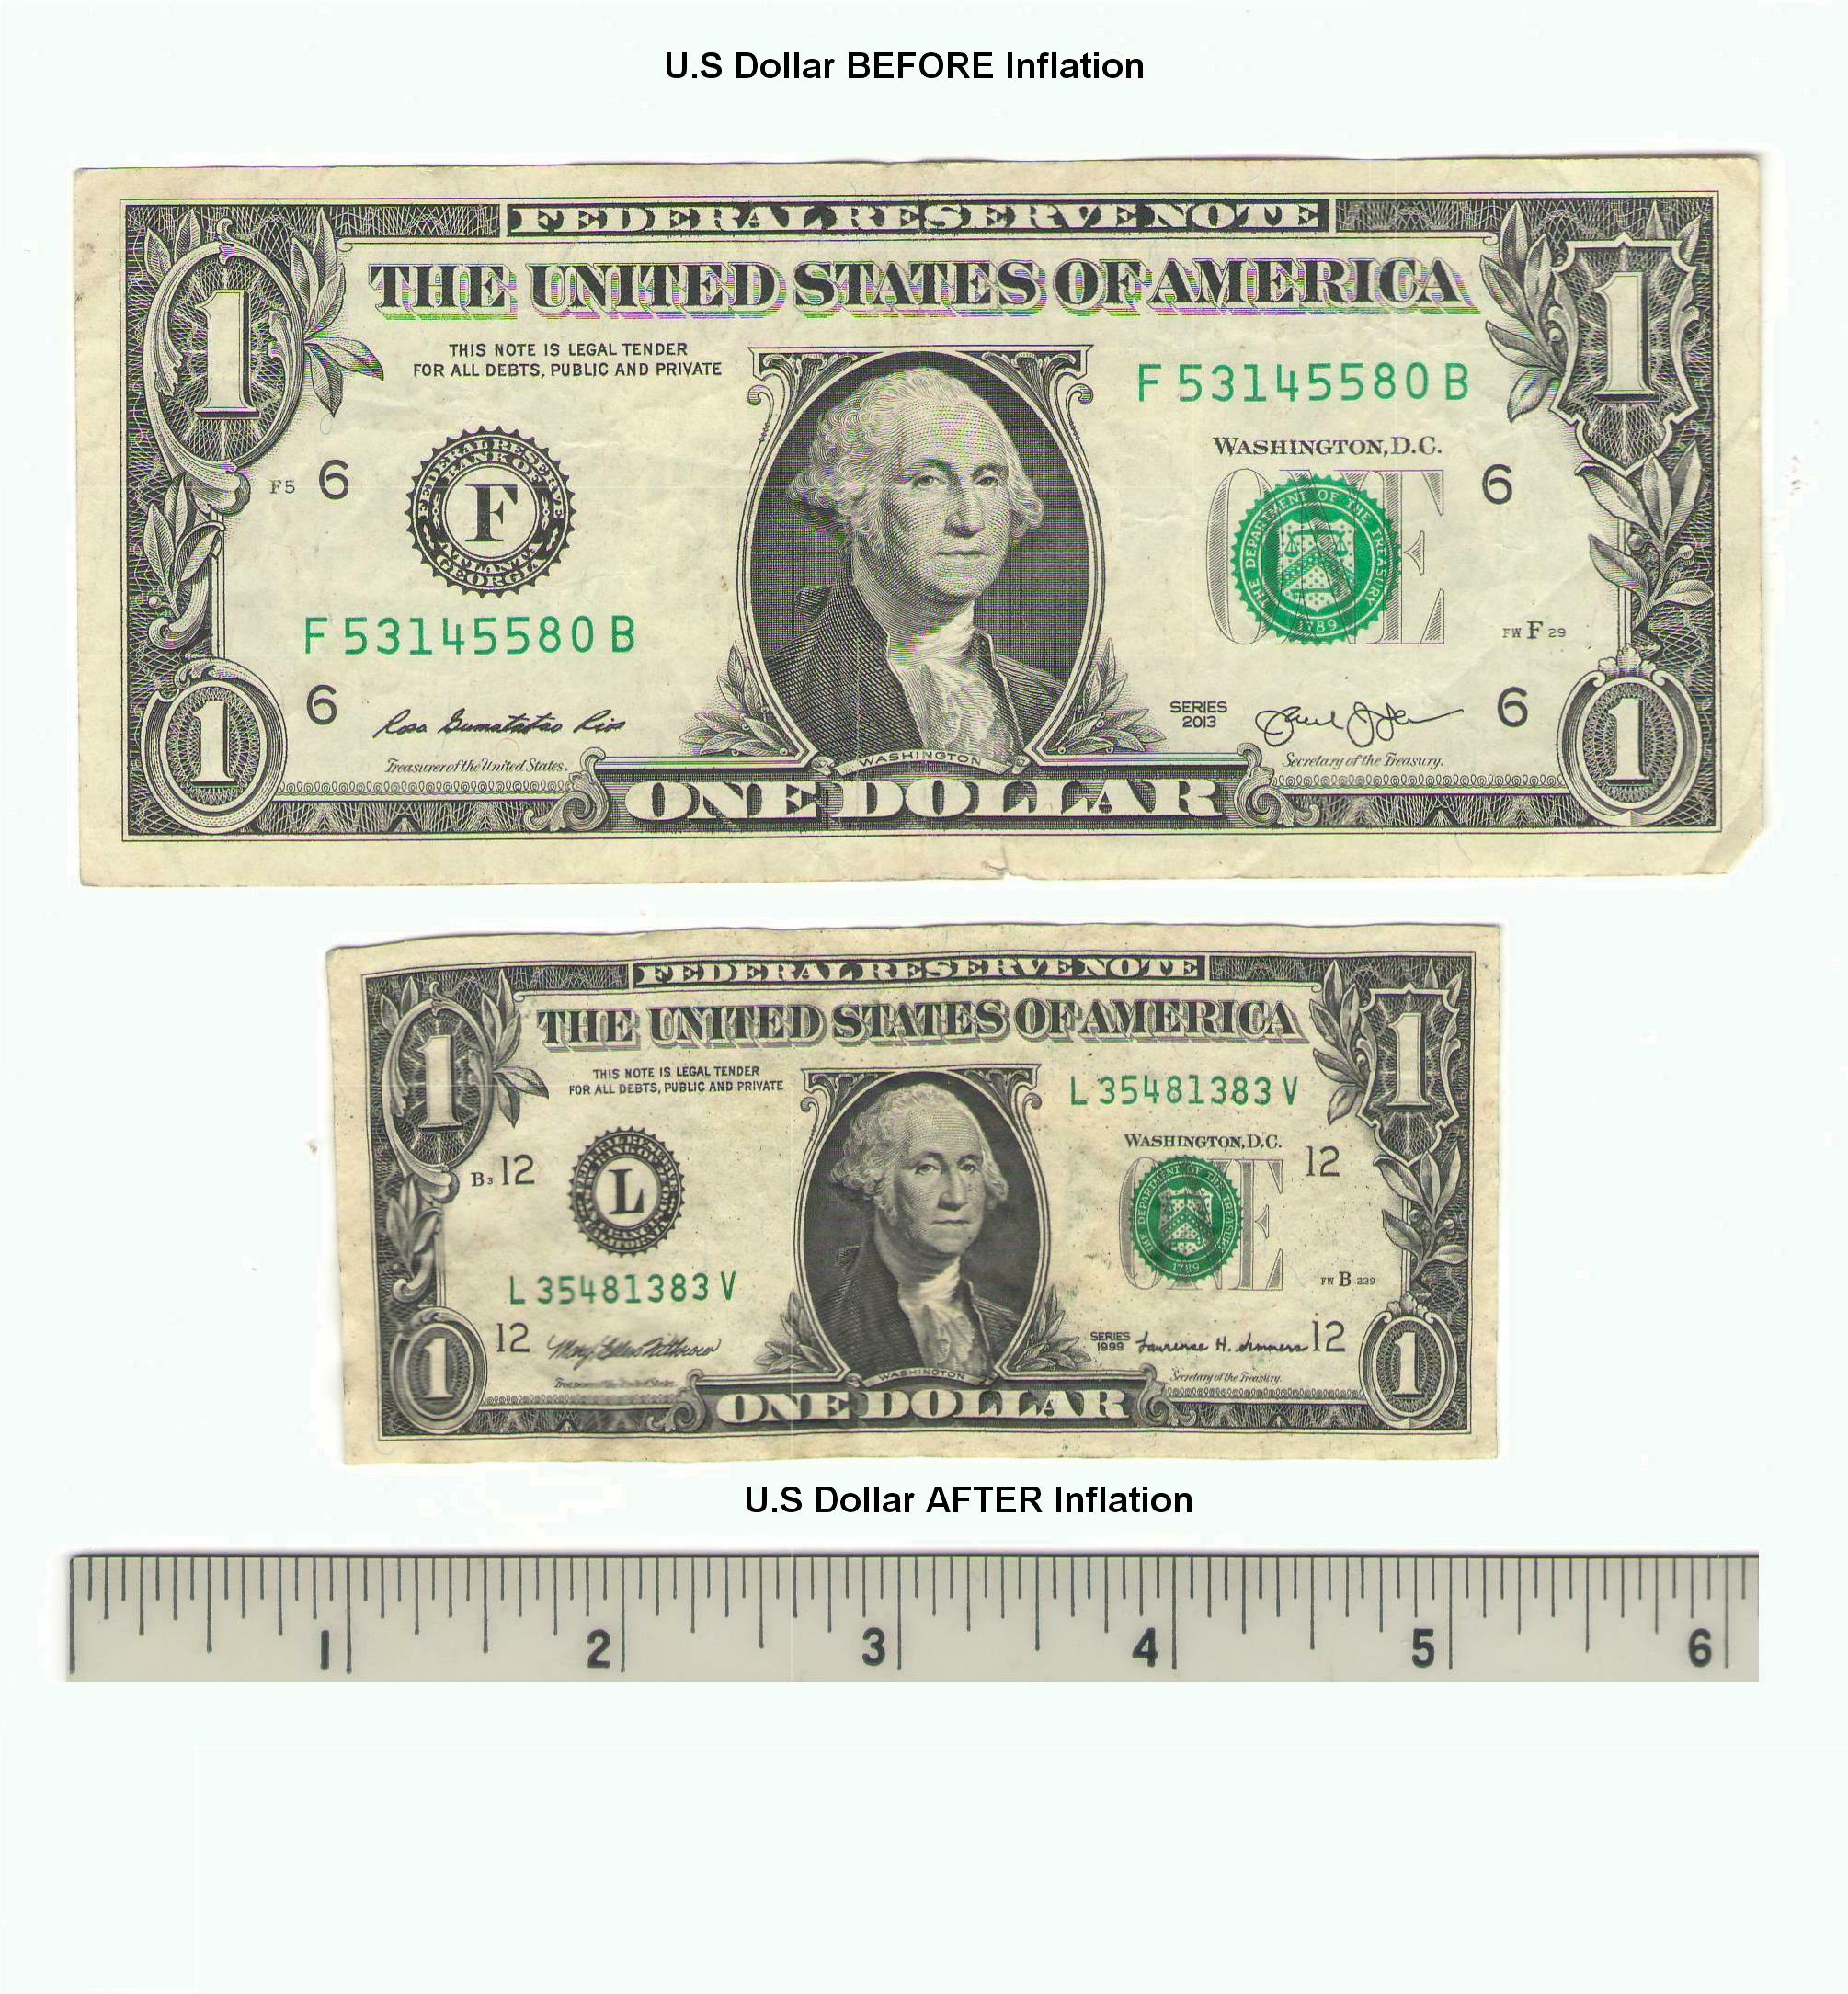
Inflation has slowed
to around 4 Percent mark.
2 above FED goal......
Hey Capitalist
When you gonna haiku here
It's been a whole Month!!!
Maybe next April 1st!!!
Breaking News, UPI - AP
April 1, 2024
It has been learned that Apple and Samsung have been caught in collusion to boost Smart Phone sales nationwide.
With shrinking national sales of phones both companies combined their sales and marketing efforts to not only sell
more units, but to enhance their stock profitability.
Who would have thought Apple and Samsung would be so devious and ambitious as to create the situation that will
occur on April 8, 2024 at around 2PM Central Time. In a stunning work of technology they have arranged for the
Moon to temporarily block out all sunlight across a huge swath of the North American continent. Through shameless
promotion of the "Solar Eclipse" they've positioned themselves for optimum results.
All Smart Phone users who attempt to directly photograph the Event will most likely "fry" their built-in cameras. When
they realize their Smart Phones aren't as smart as before the Eclipse, they'll rush out to buy a new and fully functional
replacement.
Wall Street analysts expect shares of Apple's and Samsung's common stock to surge strongly about 5 minutes after
the 2PM Central Time event.
What an amazing marketing idea! How did they manage to arrange for the Solar Eclipse, anyway?
What will they try next?
Apple's stock should soar later today or tomorrow when everyone who has an I-Phone realizes they've fried their camera trying to take pics of the Solar Eclipse!!
OAG
Will MESA's stock ever get airborne again? Maybe a quarterly surprise will get it Wheels Up..............
OAG
StockCharts 3 year history with 20% ZigZag reversals................
CRSP seems to be suffering from lack of 'sponsorship' in that the stock has not shown "accumulation" trend along with the price rally since last year's October Low. There's been volume, but not accumulation bias.
Best wishes,
OAG
Hi MD,
CRSP is now down around 1/3 from its February high. The price is where I usually start to accumulate more shares.
Best wishes,
OAG
Hi JDerb, Re: This week's v-Wave showing shorter term stress..................................
Seeing the 18 Month v-Wave moving well above the 3-5 Year assessment gives me a sense that the markets are ready for some shorter term consolidation.

Looking at how much better its estimate of the market's potential was back in 2022 and how far the indexes actually moved after that assessment should offer investors and AIMers alike some need for reflection. Market psychology doesn't favor traditional investors and traders who've now been conditioned by a long upward trend. AIMers should be checking to see if they've been following AIM's directions in boosting cash reserves at every opportunity.
I'd guess a year from now we'll be able to judge whether the current cautious outlook for the 18 Month forecast was again considered a 'good call.'
Best wishes,
OAG Tom
Yellen would suggest
Inflation doesn't erode
Purchasing Power............
Hi Toof, Re: EFA volatility and AIMing....................
That's part of the reason I chose to divide up the ex US stock markets by different "styles" of ETFs.
Stock Funds
PIZ
EFG
SCHC
DGS
DOL
DIM
DLS
DEM
VNQI
Cash and Equivalents
MMF
SNVXX
The first three stock funds are mainly growth oriented. Overall it's given a good balance and reasonable return for the ex US markets. Allocations currently range from PIZ at 12.2% down to VNQI at 7%. Cash and equals add up to around 18% currently.
Best wishes,
OAG Tom
Hi Jon, We're seeing the ST v-Wave showing stress while the longer term remains steady but well above Median.

I've been doing some work with the American Association of Individual Investors (AAII) "Allocations" database recently. It dates to around late 1987 and shows stock, bond and cash allocations monthly. Thinking back to Norman Fosback's work from years ago on cash allocations at Mutual Funds, I decided to see if there was a similar trend with individuals. Fosback had determined that cash allocations in mutual funds were the highest right at or near when the stock markets bottomed (most cautious) and were lowest at or near market tops (most aggressive). This is pretty much the mirror image of what AIM does so could be considered a very contrary market risk measure.
My preliminary study of AAII's allocations over the decades looks to follow a similar pattern. When individual investors are most optimistic they are lowest in cash allocation. This looks to occur near market tops. When the Big Bad Bear comes out to play, that's when the individual investor moves the cash allocation to the high end of its range. Again this could then be viewed as a contrary indicator - high cash = bullish signal, low cash = bearish signal. Here's a quick look at how this appears when looking at major bearish periods:
I do note that since around 2010 AAII's cash hoard has been smaller and less jumpy than in previous times. This might be because of a newer group of AAII members or a change in how quickly allocations can be changed since ETFs have become very popular. There could be other reasons, too.
In general, it seems to be that individual investors react badly during times of crisis by going heavily to Cash (usually too late). It also seems that they become complacent with their winnings during strong bullish periods and carry less "cash insurance." Mr. Lichello would just smile and shake his head! Of note is that the long average Cash Allocation is 22% and it's currently showing 16.8%, so on the LOW side. This would give us some contrary reason to be cautious, similar to our v-Wave's 18 Month current view.
Comments and Questions welcome!
OAG Tom
I thought it might be interesting to "benchmark" my International ETF portfolio against the MSCI EAFE ETF (iShares).
While my 9 ETF portfolio contains REITs and two Emerging Markets components that are not part of EFA, it still gives a pretty good representation of the ExUS market.
EFA recently did reach past its previous high from late in 2021 where my portfolio is now just about equal to its high water mark. Considering AIM's cash, the three components that EFA doesn't include to any degree and the relatively low price range of my portfolio and we see AIM's done a pretty good job of staying with EFA on the upside while limiting the downside (even with Mr. Putin's activity).
I don't know how AIM would have done with EFA all by itself, but my portfolio's three growth and three value components passed the baton back and forth a bit while EFA didn't have that luxury. Over all, it's worked out fine.
Best wishes,
OAG Tom
Q1 Finals for Tom's International Equity Warehouse:
IRA (no longer a contributing IRA since I retired)
10 Common Stock Composite (each stock a separate AIM engine)
International "Style" type ETF composite portfolio
(Large, Mid and Small Cap ETFs in both Growth and Value plus Intl REITs and Small and Large Emerging Markets Dividend ETFs)

U.S. Business Sector ETF Composite
(built primarily from equal weight ETFs)

Overall these accounts are doing well and equaled or broke into new all time highs in March. Cash is starting to rebuild to healthier levels.
Happy Long Weekend,
OAG Tom
EPD tipping the scales at nearer $30/share. Value Line offers an 18 month "Appreciation Potential" of $23 to $32. It's 3-5 Year estimated potential is $45 to $70! Even the lower end of that would make me smile.
From Value Line:
Enterprise’s finances ought to able to manage its large construction program. The partnership reduced spending in 2021 and 2022, but it returned to more normal levels in 2023. The U.S. has become the world’s biggest exporter of LNG and EPD should benefit from this.
MLP investors may want to take a closer look at these neutrally ranked units. The current yield of around 8% is well above the Value Line median and in line with other midstream entities. Moreover, potential returns out to 2027-2029 are attractive. In addition, the partnership size and presence in all the major shale plays and end markets makes it less vulnerable to a specific problem in any sector or territory.
James A. Flood February 23, 2024
This from Mr. Buffett's annual newsletter to shareholders:
In Warren Buffett’s most recent annual shareholder letter, he wrote,
“Though the stock market is massively larger than it was in our early years, today’s active participants are neither more emotionally stable nor better taught than when I was in school. For whatever reasons, markets now exhibit far more casino-like behavior than they did when I was young.”
Nicely stated, Mr. Buffett!
Best wishes,
OAG Tom
If Earnings don't match
upward growth of Stock Prices
this Rally won't last...........
Derived from Elaine Garzarelli's work combining a broad P/E with short term interest rates, the Relative Valuation Index looks at the risk involved in Stocks vs the "risk free" rate of short treasuries. Sadly, right now this 2024 rally looks like it's not backed by either a drop in interest rates or growth in earnings.
Hi Pete, Re: Spreading it around...............
I own EMLP as a catch-all in this space, too. It's in a different portfolio. I trim it by 5% as prices climb and add 6% on the dips. Roughly there's a 20% LIFO turn on the round trips. They don't happen very often, however!
Thanks for the thoughts. Barclays upper target is about where I'll let the next 10% of shares go.
Best wishes,
OAG Tom
A longer look at RIG........................
https://schrts.co/KssPeddX
A nice upturn in Accumulation..............
OAG Tom
JETS shows good accumulation since last year's low point.
https://schrts.co/eBAAYSNz
Best wishes,
OAG
.....and the histogram.................

OAG Tom
Hi Steve, Re: Cap vs Equal Weight Sector ETFs.............
For me it was to get greater exposure on smaller cap companies while still using primarily Sector ETFs. I know over time there will be sector rotation with either Cap or Equal Weight sectors - that's good news for AIM. I also know there are times of exuberance that will be mostly seen in the very large cap stocks. Small caps generally don't get pumped like the mega cap stocks. I have a secret ingredient in my Sector ETF portfolio, XLG. It's "Top 50 Stocks" of the S&P 500 in capitalization. It behaves like the S&P 500 to a degree since the other 450 stocks don't have the 'push' that those 50 do.
https://stockcharts.com/freecharts/perf.php?XLG,SPY&n=1259&O=011000
So, it's a favorite toy in the ETF toy chest. It tends to shine in FOMO markets even thought it crosses over between sectors. One could call it a modern "Nifty 50" I guess. Overall, the portfolio has better diversification with the mix I currently own. It's been a while since my account started using the equal weight sector funds. There's pretty fat cap gains in most of the positions which makes me hesitant to make a change at this point. The tactic of using Sectors and AIM has proved to be successful. The further tactic of using equal weight sectors has given me a portfolio of better diversification, I believe. The Domestic Division of Tom's International Equity Warehouse (T.I.E.W.) has been a solid performer.
In the mean time, TIEW's International Division is doing well compared to typical EAFE type funds. It's based in "style" ETFs (Large, mid and small caps, in both Value and Growth). Years ago there were exUS sector ETFs but they vanished. So, I had to convert the International Division over to its current form. In general it's worked well. Here's the 12 month performances with the far right being the EAFE ETF for comparison:
https://stockcharts.com/freecharts/perf.php?PIZ,EFG,SCHC,DGS,DOL,DIM,DLS,DEM,VNQI,EFA&n=252&O=111000
.............and how the composite AIM'd accounts have looked through the end of last month:
Again, I've held this portfolio's structure relatively constant for a long time. It's underperformed the U.S. ETF sector portfolio, but is doing okay. It doesn't represent as many $$$ as does the U.S. portfolio.
Have a great weekend,
OAG Tom
For fun, I did a comparison of the Cap Weighted Sector ETFs with their Equal Weight brothers. If you stretch the X-Axis to 252 days you'll have a full year's view:
Cap Weighted
https://stockcharts.com/freecharts/perf.php?XLY,XLC,XLK,XLI,XLB,XLE,XLP,XLV,XLU,XLF,XLRE&n=252&O=111000
Equal Weighted
https://stockcharts.com/freecharts/perf.php?RSPC,RSPD,RSPS,RSPG,RSPF,RSPH,RSPN,RSPM,RSPR,RSPT,RSPU&n=252&O=111000
There are similarities and differences. Some Equal Weight beat their Cap Weight brothers and visa versa.
Here's the composite of how mine have done with AIM's management:

(Note: I AIM each of the Equal Weight sectors in my U.S. Sector ETF portfolio)
Have a great weekend,
OAG Tom
Thanks Steve, Re: 4 Year Compound Inflation chart................
That's a very cool history. Thanks for sharing it.
Best wishes,
OAG Tom
While attempting to log into iHub from my phone, I found someone seems to have hijacked one of my email addresses. How can I eliminate that fake membership?
The "Alias" attached to my email is "KingMagician64" and this isn't my account.
Any suggestions as to how to rid i-Hub of this email yijacker?
Best wishes,
Tom Veale
aka: OldAimGuy
Now that the markets are recovering from Eye Strain from staring at the FED's video, will they start to look at other reasons to either go up or down?

OAG Tom
My motto has been "Buy from the Scared, Sell to the Greedy" so my STKL is closer to a selling point than a buy right now.
Thanks for the article,
OAG
This week's v-Wave in Living Color.............................

It's a long way from Proactive and hugging the edge of Caution........
OAG
He stopped by for some sushi!!!
It's a white pine at the lakefront of our cottage.
Ice went out last week so Big Bird is back.
OAG
Eagle Eye in the AM Sky......

He's AIMing for a tasty breakfast.
OAG Tom

