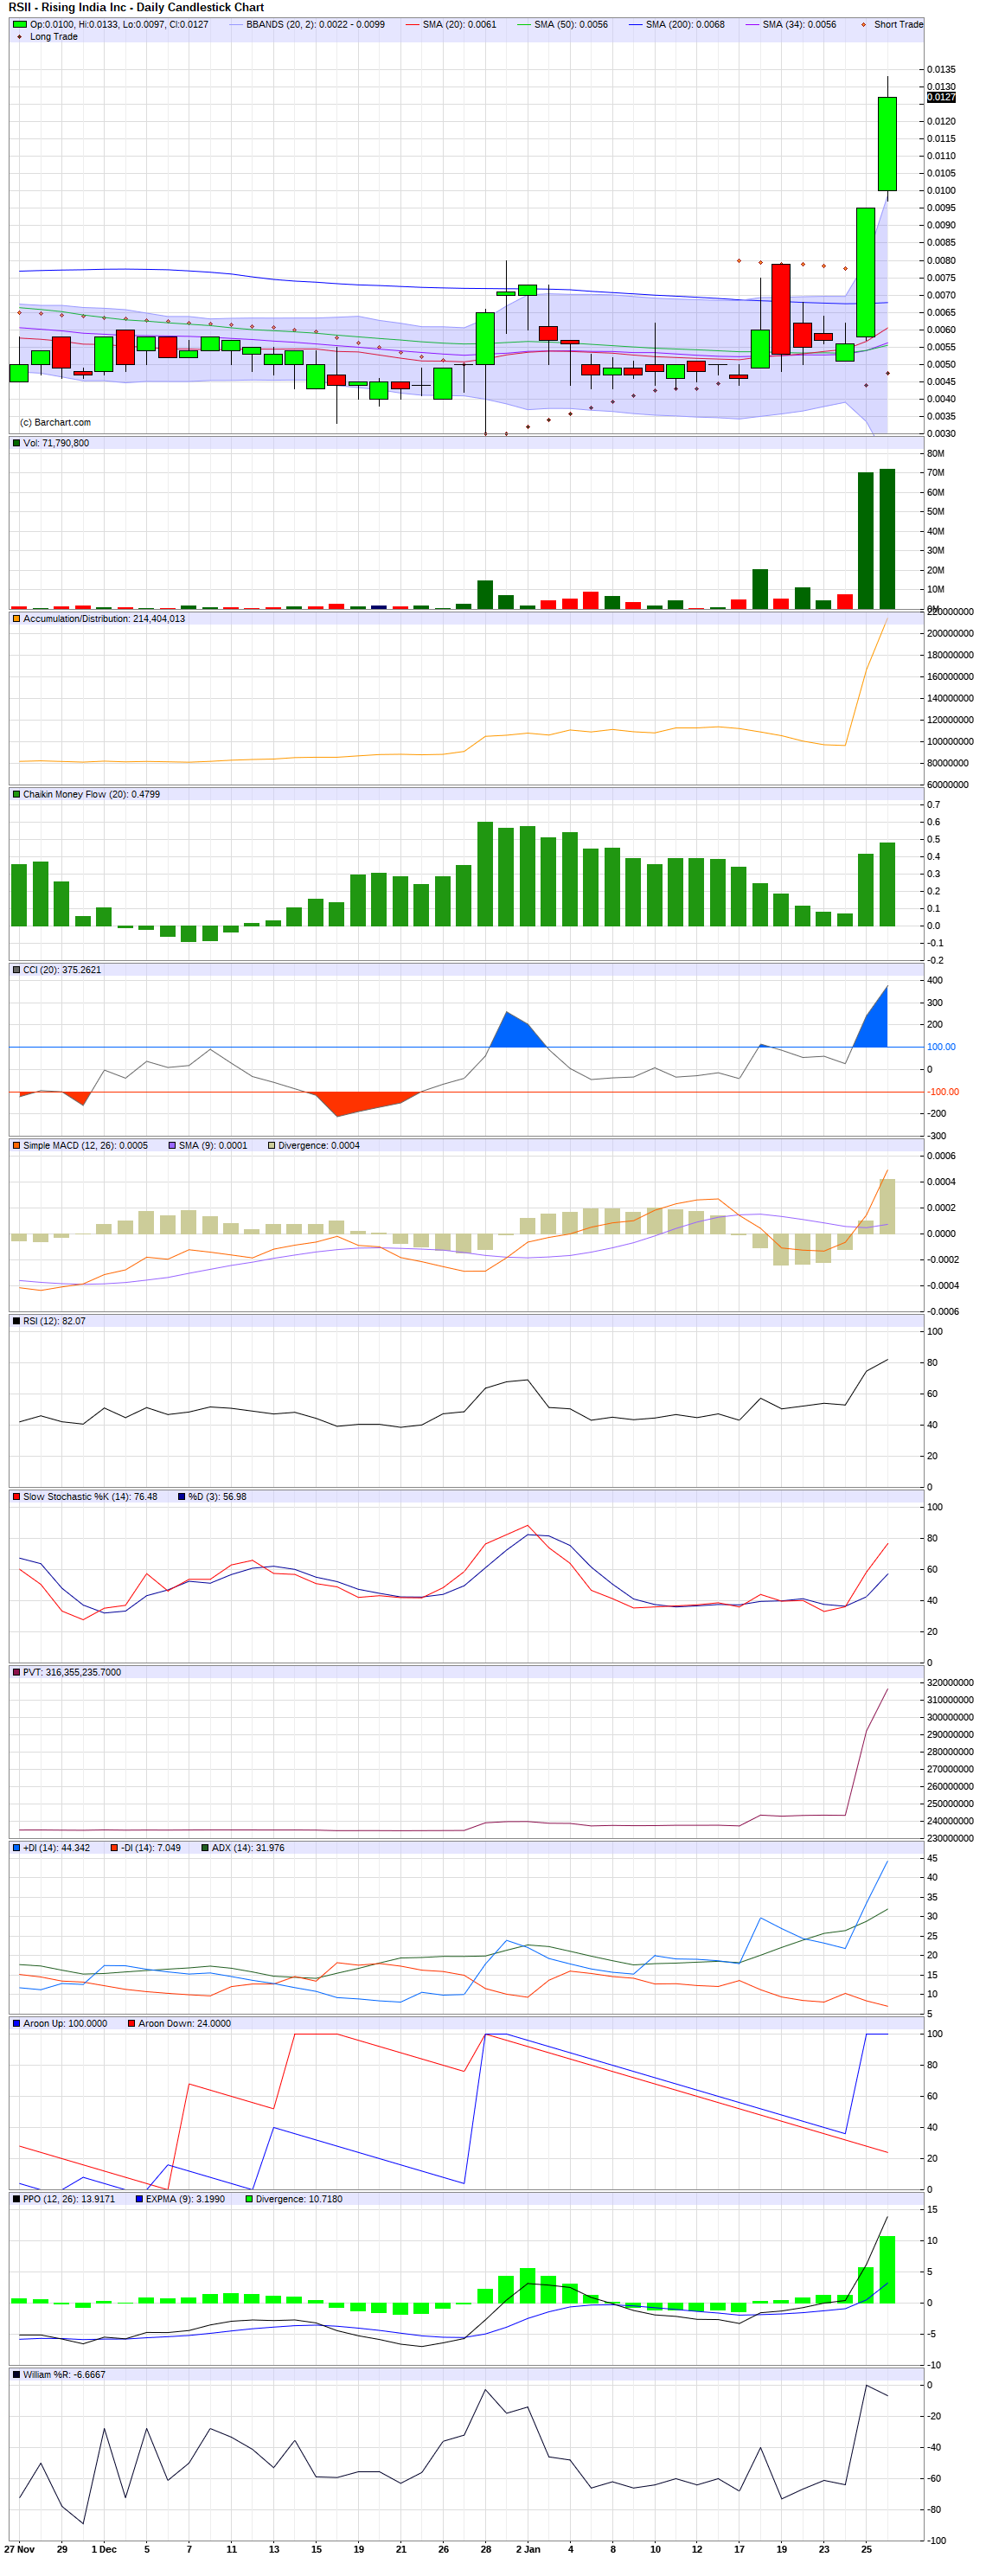
Parabolic Sar.....the little dots above and below the bars....BULLISH when underneath such as now!
Blue Cloud in chart is the Bollinger Bands.....they just went up and down....BULLISH!
In F-ing credible volume@@@ BULLISH!!!
CCI above the 0 mark!!! BULLISH!!BUY SIGNAL!!!!
Red line has crossed above the Blue line on MACD BUY SIGNAL!!!
RSI above 70 in the POWER ZONE!!!
Stochastics line cross....BUY SIGNAL!!!!
ADX Blue line above the Red line....BULLISH and an early indicator of BUY SIGNAL!!!
Arroon Blue line above the red line....BULLISH and an early indicator of BUY SIGNAL!!!
PPO line cross BUY SIGNAL!!!
Williams %R....above the 50....BULLISH and is a BUY SIGNAL!!!
Heikin Ashi Chart
For starters shows trend.....GREEN VERY GOOD...
If you look at the blue Cloud in the chart Bollinger Bands ...it was straight across and now splitting up and down....BUY SIGNAL and BULLISH!!!
Ichimoku Cloud That is the red cloud in the chart....BUY SIGNAL when it breaks above and sell signal when it breaks below...BUY SIGNAL The green line that is spiking straight up is also part of the Ichimoku Cloud....VERY BULLISH and that line will also end up showing where support is.
The MACD line crossing above....you can easily see that it was spot on as a BUY SIGNAL!!!
RSII
RSII Heikin Ashi Chart

Blue Cloud in chart is the Bollinger Bands.....they just went up and down....BULLISH!
In F-ing credible volume@@@ BULLISH!!!
CCI above the 0 mark!!! BULLISH!!BUY SIGNAL!!!!
Red line has crossed above the Blue line on MACD BUY SIGNAL!!!
RSI above 70 in the POWER ZONE!!!
Stochastics line cross....BUY SIGNAL!!!!
ADX Blue line above the Red line....BULLISH and an early indicator of BUY SIGNAL!!!
Arroon Blue line above the red line....BULLISH and an early indicator of BUY SIGNAL!!!
PPO line cross BUY SIGNAL!!!
Williams %R....above the 50....BULLISH and is a BUY SIGNAL!!!
Heikin Ashi Chart
For starters shows trend.....GREEN VERY GOOD...
If you look at the blue Cloud in the chart Bollinger Bands ...it was straight across and now splitting up and down....BUY SIGNAL and BULLISH!!!
Ichimoku Cloud That is the red cloud in the chart....BUY SIGNAL when it breaks above and sell signal when it breaks below...BUY SIGNAL The green line that is spiking straight up is also part of the Ichimoku Cloud....VERY BULLISH and that line will also end up showing where support is.
The MACD line crossing above....you can easily see that it was spot on as a BUY SIGNAL!!!
RSII

RSII Heikin Ashi Chart
Replies:
can you post the link to that post
MisterEnzo on 1/27/2018 7:35:28 PM
SAR to .10 ... news may help :}
stock_diver on 1/27/2018 8:12:19 PM