 News
News  Market Data
  Discover
Support: 888-992-3836
Copyright © 2023 InvestorsHub Inc.


Register for free to join our community of investors and share your ideas. You will also get access to streaming quotes, interactive charts, trades, portfolio, live options flow and more tools.
RSVP today for our upcoming winter webinar http://conta.cc/2gKXGJr
Video 8/15 TradeXchange - Market Wrap Up $SPY $USO $GOGO $LIVE $OCUL $BW
Market Wrap Up Video $SPY $USO $HTBX $SM $INTC https://thetradexchange.com/tx-blog/ "Built For Traders, By Traders"
Video TradeXchange - Market Wrap Up $SPY $USO $DYN $INFN $ADXS $ SSYS
if NFLX passes the $80 support (I do not see any problem for it) then the next possible stuck would be around $63-67 and after that around $49-53. Those are the levels were the biggest volume was accumulated. Big number of the Bulls opened their long positions at these levels and as the NFLX will be on the edge to turn a lot of bullish investments from positive into negative this will a sensitive moment for many investors. In addition these levels match past support/resistance levels.

chart courtesy of http://www.marketvolume.com
zozotrader: Video Get ready for the week ahead 4/25 to 4/29 http://ticker.tv/zozotrader/571d715ef72261895758cbe1
Checkout (JCP) J.C Penny's near Bouncepoint!
$NFLX can squeeze...look at $PCLN break a wedge and launch
When the market as a whole is picking up strength, don't waste time with stocks that aren't acting ideal. $SPY $QQQ
Stop Trading to recover #education
Read: http://stks.co/s2j9r
Stop Trading to recover
STOP Trading to recover...
If you are a trader and you are losing money each day or each week or each month or by the year You need to stop trading… If you can’t stop trading there is no helping you until you can make yourself stop trading. This is harder than you think for many..
If you can stop you can be helped if not you will be doomed and fade away…
Now that you have stopped (if you have) The next thing is to take everything you use off your charts… Have price action (via candles) and volume only Why because what you were using was not working.
Keep it simple look for support and resistance and start lining your charts draw the lines do this for 2 weeks or more Look at charts charts charts… Line your charts Line your charts watch the action
Slowly start to add back some moving averages and indicators like one every few days Watch it closely test it see if it is important to have on your chart….
Start to paper trade again to build up confidence be honest as you can in your paper trades
When will you be able to Trade again When you can explain to others the reason you took the trade as if someone was watching you and you can tell them clearly what you see to get you in this trade.
When will you be able to trade when you can see what your stop should be from looking at the price action and support and resistance on the charts
This can take up to a month or more before you can get back to trading You must look a many charts train your eye and mind again
You have been injured recovery can be slow You must start over again You must take your time coming back… Don’t rush the comeback you may never get another chance to trade monetarily or mentally
If you are serious about wanting to Trade you will Stop trading If you are serious about trading you will take off from trading and study the charts again for awhile… It is about training your eye and mind again Chart- set-up recognition….
Good luck
Don’t be in a rush to come back.. Take your time the market will always be here
This is not all the answers but just some suggestions on some things you can do to get back on Track
It is a process to recover like physical Therapy and if you rush to get back you'll just re-injure yourself and possibly end your career ..
Best to you
New Video 7/14 Trade Ideas large and small stocks http://ticker.tv/zozotrader/55a46b5072fa099f355ed1b6
Lets get ready for the week ahead Video 7/13/7/17 @ticke.tv http://stks.co/f2lKz
Large stock watch list for 6/25 http://ticker.tv/zozotrader/558b69cb72fa09ab489fddb5
Video 3 Small stocks for the week ahead 6/22-6/26 http://ticker.tv/zozotrader/558746db72fa0943709fddb5
Video 2 6/22-6/26 Large Cap WatchList http://ticker.tv/zozotrader/55872a1c72fa095a619fddb6
Video #1 Get ready for the week ahead 6/22 to 6/26 - http://Ticker.tv http://ticker.tv/zozotrader/5585c67a72fa09b751f6fed2 … … … $SPY $QQQ $AAPL $GOOGL and more
3 Videos for the week ahead 1 on the market 2 on some large stocks 3 on some smaller stocks
Getting ready for the week ahead http://ticker.tv/zozotrader/556b0b22c9f9095031000038
Video 2 6/1 Large stocks watch list
http://ticker.tv/zozotrader/556b20f8c9f9093846000049
Video 3 6/01 smaller stock watch list
http://ticker.tv/zozotrader/556b3d2cc9f909945f00000d
5/29 watchlist Video - http://Ticker.tv http://ticker.tv/zozotrader/5567b01bc9f909a05800009e … $GEVO $GENE $EYES $GTXI $NVIV $ONVO and more
Video to get ready for tomorrow 5/27 Stockwatch Market talk small and large
youtube.com/watch?v=5Hmxrzs...
Stock trades from 5/22 $FEYE $RWLK $LCI $HIMX
5/25 video for week ahead part 1 http://ticker.tv/zozotrader/556287fdc9f9094962000070
Part 2 video 5/25 Stocks watch Small stocks http://ticker.tv/zozotrader/55628ca2c9f9096521000002
5/25 part 3 large stocks watch list http://ticker.tv/zozotrader/556290e6c9f909653b000006
SLTD DOING BIG WORK TODAY AND THIS WEEK CHECK IT OUT! UP IN PREMARKET ITS GONNA BOOM NEXT WEEKS CHECK THE CHART
$PIRATERAID $FIATY
Yar! Get on board fer an e-z take down, low volume, massive up-side over the long. Ram her starboard and shake free the chump traders!


TEU looks ready for a breakout imo.
http://finance.yahoo.com/news/box-ships-teu-enters-oversold-112010921.html
$Hemp ready for take off...CHART DOESNT LIE!!!!!!!!
American Bulls has a BUY signal:
ONCOSEC MEDICAL
__________________________________________________
BUY
Last Pattern:BULLISH HARAMI CROSS
Last Close:0.2670 Change:+0.0131 Percent change+5.16%
Signal Update Our system’s recommendation today is to BUY. The BULLISH HARAMI CROSS pattern finally received a confirmation because the prices crossed the confirmation level which was at 0.2605, and our valid average buying price stands now at 0.2610. The previous SELL recommendation was issued on 10/4/2013, 11 days ago, when the stock price was 0.2732. Since then ONCS has fallen by -4.47%.
Market Outlook Let’s jump on our white horses and go for a bullish ride. The bullish pattern that was previously identified is finally confirmed and a BUY signal is generated. Most probably, it is the right time to participate in bullish fervor. The market is telling you about a new profit. Do not miss this bullish opportunity.
_______________________________________________________
Their 24 month history with ONCS is for every $100 invested $1,124.67 would have been earned.
http://americanbulls.com/SignalPage.aspx?lang=en&Ticker=ONCS
ONCS
AMRN
Amarin Announces First Notification of U.S. Patent Allowance Based on ANCHOR Clinical Trial ResultsGlobeNewswire(Wed 11:28AM EST)
XOMA breakout and huge news today charting

weeklychart break above 50 MA + MACDe ready to triger bullish
$MNI looking good 
TRADING RADAR9/3-9/7
Monday, September 3
US Economics (Time Zone: EDT)
US Markets are closed for Labor Day holidays
Global Economics (Time Zone: GMT)
05:00 JPY Vehicle Sales
08:00 EUR PMI
Earnings
No earnings
Tuesday, September 4
US Economics (Time Zone: EDT)
08:58 Markit US PMI Final – consensus 51.9
10:00 ISM Manufacturing – consensus 50.0, prior 49.8
10:00 ISM Prices Paid – consensus 46.0, prior 39.5
10:00 Construction Spending – consensus 0.4%, prior 0.4%
5:00 Total Vehicle Sales – consensus 14.20M, prior 14.05M
5:00 Domestic Vehicle Sales – consensus 11.03M, prior 11.00M
11:00 Fed purchasing $1.5b-2b bonds in 25 to 30-year range
11:30 Treasury to sell $32b 3-month, $28b 6-month bills
2:00 Fed to purchase $4.25b-$5b 6 to 8-year range
Global Economics (Time Zone: GMT)
01:30 AUD Current Account Balance
04:30 AUD Royal Bank of Australia Cash Target
07:00 EUR Spanish Unemployment
09:00 EUR Eurozone PPI
10:00 Greece to sell bills
11:00 EFSF to sell EU2b in 91-day bills
Earnings
Before:
Campbell Soup (CPB) EPS 38c
Smithfield Foods (SFD) EPS 45c
After:
Bloomin Brands (BLMN)
Finisar (FNSR) EPS 14c
Wednesday, September 5
US Economics (Time Zone: EDT)
07:00 MBA Mortgage Purchase Index
08:30 Nonfarm Productivity – consensus 1.8%, prior 1.6%
08:30 Unit Labor Costs – consensus 1.5%, prior 1.7%
09:45 ISM New York – consensus 55.2
11:00 Fed purchasing $4.5b-$5.5b in 8 to 10-year range
11:30 U.S. to sell 4-week bills
Global Economics (Time Zone: GMT)
01:30 AUD GDP
02:30 CNY HSBC Services PMI
08:00 EUR PMI Composite, Services
08:30 GBP UK PMI Services
09:00 EUR Eurozone Retail Sales
9:30 U.K. to sell GBP 1.75b 30-year bonds
10:30 Germany to sell EU5b 10-year notes
Earnings
After:
Verifone (PAY) EPS 70c
Dollar General (DG) EPS 64c
Thursday, September 6
US Economics (Time Zone: EDT)
07:30 Challenger Job Cuts YoY – prior -44.5%
08:15 ADP Employment Change – consensus 140K, prior 163K
08:30 Initial Jobless Claims – consensus 370K, prior 374K
08:30 Continuing Claims – consensus 3315K, prior 3316K
10:00 ISM Non-Manufacturing Composite – consensus 52.5, prior 52.6
11:00 Fed buying $1.5b-$2b Treasuries in 25 to 30-year range
Global Economics (Time Zone: GMT)
01:30 AUD Unemployment Change
09:00 EUR Eurozone GDP
10:00 EUR German Factory Orders
11:00 GBP Bank of England Rate Decision
11:45 EUR ECB Rate Decision
8:30 Spain to sell bonds
9:30 France to sell bonds
Earnings
Before:
No reports
After:
Smith & Wesson (SWHC) EPS 18c
Ulta Salon (ULTA) EPS 51c
Hovnanian (HOV) EPS -11c
Friday, September 7
US Economics (Time Zone: EDT)
08:30 Nonfarm Payrolls – consensus 125K, prior 163K
08:30 Private Payrolls – consensus 139K, prior 172K
08:30 Manufacturing Payrolls – consensus 10K, prior 25K
08:30 Unemployment Rate – consensus 8.3%, prior 8.3%
08:30 Average Weekly Hours – consensus 34.5, prior 34.5
08:30 Underemployment Rate – prior 15.0%
11:00 Fed to sell $7b-$8b notes in 1 to 2-year range
Global Economics (Time Zone: GMT)
06:00 EUR German Trade Balance
06:00 EUR German Current Account Balance
07:00 EUR Spanish Industrial Output
11:00 UK to sell bills
Earnings
Before:
Kroger (KR) EPS 49c
ECONOMIC FRIDAY 8/31
Chicago PMI
9:45 AM ET
Consumer Sentiment
9:55 AM ET
Ben Bernanke Speaks
10:00 AM ET
Factory Orders
10:00 AM ET
Farm Prices
3:00 PM ET
looks okay worth a shot not something for me though volume to low but you do well with these GL
I like $MNI here, massive short position...what you think? Turnaround quarter/story headed into election...
Thursday's economic calendar:
Chain Store Sales
8:30 Initial Jobless Claims
8:30 Personal Income and Outlays
9:45 Bloomberg Consumer Comfort Index
10:00 Factory Orders
10:30 EIA Natural Gas Inventory
11:00 Kansas City Fed Mfg Survey
1:00 PM Results of $29B, 7-Year Note Auction
4:30 PM Money Supply
4:30 PM Fed Balance Sheet
Notable earnings after Thursday’s close: OVTI, SAI, SPLK [
Notable earnings before Thursday’s open: BRLI, CIEN, TD [
Wednesday's economic calendar:
7:00 MBA Mortgage Applications
8:30 GDP Q2
8:30 Corporate Profits
10:00 Pending Home Sales
10:30 EIA Petroleum Inventories
1:00 PM Results of $35B, 5-Year Note Auction
2:00 PM Fed's Beige Book
Notable earnings after Wednesday’s close: P, TIVO, WFT
Notable earnings before Wednesday’s open: FRO, HNZ, JASO, JOY, YGE
My largest holding right now...thought you might find the story worth tracking:
$WH
http://seekingalpha.com/article/778771-wsp-holdings-limited-bursting-at-the-seams-and-set-to-explode
Tuesday's economic calendar:
7:45 ICSC Retail Store Sales
8:55 Redbook Chain Store Sales
9:00 S&P Case-Shiller Home Price Index
10:00 Consumer Confidence
10:00 State Street Investor Confidence Index
10:00 Richmond Fed Mfg.
August 27 US Economics
08:30 Dallas Fed - consensus -7.0, prior -13.2
Trading Radar 8/27 to 8/31
Monday, August 27
US Economics (Time Zone: EDT)
08:30 Dallas Fed - consensus -7.0, prior -13.2
11:00 Fed to purchase $1.5b-$2b notes in 25 to 30-year range
11:30 Treasury selling $32b 3-month bills, $28b 6-month bills
Global Economics (Time Zone: GMT)
01:30 CNY Industrial Profits YTD
06:00 JPY Machine Tool Orders
08:00 EUR German IFO- Business Climate
10:30 Germany selling EU3b 12-month bills
Earnings
Before:
Tiffany's (TIF) EPS 73c
Samsonite (SMSOF) EPS 6c
After:
Tuesday, August 28
US Economics (Time Zone: EDT)
09:00 S&P/Case Shiller 20 City Index MoM - consensus 0.30%, prior 0.91%
09:00 S&P/Case Shiller 20 City Index YoY - consensus -0.10%, prior -0.66%
10:00 Consumer Confidence - consensus 65.9, prior 65.9
10:00 Richmond Fed - consensus -11, prior -17
11:00 Fed selling $4.5b-$5.5b in 8 to 10-year range
11:30 Treasury selling 4-week bills
1:00 U.S. to sell $35b 2-year notes
Global Economics (Time Zone: GMT)
CNY Leading Index
01:00 AUD HIA New Home Sales
06:00 EUR German GFK Consumer Confidence
06:00 CHF UBS Consumption Indicator
9:30 Spain to sell 3-month,6-month bills
10:00 Italy to sell coupon bonds
Earnings
No major reports
Wednesday, August 29
US Economics (Time Zone: EDT)
07:00 MBA Mortgage Purchase Index
08:30 GDP QoQ (Annualized) - consensus 1.7%, prior 1.5%
08:30 Personal Consumption - consensus 1.5%, prior 1.5%
08:30 GDP Price Index - consensus 1.6%, prior 1.6%
08:30 Core PCE - consensus 1.8%, prior 1.8%
10:00 Pending Home Sales - consensus 1.0%, prior -1.4%
10:00 Pending Home Sales YoY - consensus 9.0%, prior 8.4%
2:00 Fed's Beige Book
11:00 Fed purchasing $4.25b-$5b in 6 to 8-year range
1:00 U.S. to sell $35b 5-year notes
Global Economics (Time Zone: GMT)
07:00 CHF KOF Swiss Leading Indicator
12:00 EUR German CPI
23:50 JPY Large Retailer Sales
10:00 Italy to sell bills
Earnings
Before:
Joy Global (JOY) EPS $1.89
Fresh Market (TFM) EPS 27c
Heinz (HNZ) EPS 80c
After:
Pandora (P) EPS -3c
TiVo (TIVO) EPS -24c
Vera Bradley (VRA) EPS 35c
Thursday, August 30
US Economics (Time Zone: EDT)
08:30 Initial Jobless Claims – consensus 370K, prior 372K
08:30 Continuing Claims – consensus 3306K, prior 3317K
08:30 Personal Income - consensus 0.3%, prior 0.3%
08:30 Personal Spending - consensus 0.5%, prior 0.0%
08:30 PCE Deflator - consensus 1.4%, prior 1.5%
08:30 PCE Core - consensus 1.7%, prior 1.8%
11:00 Kansas City Fed - consensus 0, prior 5
11:00 Fed buying $1.5b-$2b Treasuries in 25 to 30-year range
1:00 Treasury selling $29b 7-year notes
Global Economics (Time Zone: GMT)
01:00 NZD NBNZ Business Confidence
07:55 EUR German Unemployment Change
08:30 GBP Net Consumer Credit
09:00 EUR Eurozone Consumer Confidence
23:30 JPY Household Spending
23:30 JPY CPI
10:00 Italy to sell bonds (floating, zero coupon)
Earnings
Before:
Ciena (CIEN) EPS -2c
After:
Friday, August 31
US Economics (Time Zone: EDT)
09:45 Chicago PMI - consensus 53.5, prior 53.7
09:55 University of Michigan Confidence 2nd Revision - consensus 73.6, prior 73.6
10:00 Factory Orders - consensus 1.5%, prior -0.5%
10:00 Bernanke speaks at Jackson Hole
1:15 BoE's Posen speaks on monetary policy at Jackson Hole
2:30 IMF's Lagarde speaks at Jackson Hole
Global Economics (Time Zone: GMT)
05:00 JPY Housing Starts
06:00 EUR German Retail Sales
06:00 GBP Nationwide House Prices
09:00 EUR Eurozone CPI
09:00 EUR Eurozone Unemployment Rate
12:30 CAD GDP
11:10 UK to sell bills
|
Followers
|
26
|
Posters
|
|
|
Posts (Today)
|
0
|
Posts (Total)
|
7190
|
|
Created
|
04/12/11
|
Type
|
Free
|
| Moderator ZoZoStockWatch | |||
| Assistants FLORIDAGRL tbirdman | |||

Thanks, but PLEASE NO PINKS ON THIS BOARD


 TO $TOCK NEWS $STOCK CHARTS $TOCK $TUFF
BEARS MAKE MONEY BULLS MAKE MONEY PIGS GET SLAUGHTERED


PLACE STOPS, TRADE SMART AND CONTROL YOUR GREED!

1. DO THE MATH!!! - Before placing any trade, do the math. Where is the trigger? Where is the proper stop based on the chart setup? How many shares should I buy? This is easy to figure out. You never want to lose more than 1% of your trading account balance on any given trade. So, if you have a $30,000 account, your maximum acceptable loss on any given trade should be $300. If the stop is .20 cents below the entry price (again, based on the chart setup), then you should not buy more than 1500 shares (for the purpose of this lesson I have left commissions out of the equation for simplicity).
2. PAY YOURSELF!!! - Once you have a small profit (I use a dime as a rough personal guideline) sell part of your position and move your stop to breakeven on the rest. You will have very few losing trades if you do this, and the losses you do have will be small.
3. STOP TRADING!!! - What do I mean by this? If you hit your daily goal (everyone should have one and make it realistic) stop trading. Afternoons are tougher to trade than mornings anyway, so take the money and run....tomorrow is another day.
4. STOP TRADING!!! - Didn't we go over this already? Well, this one has another meaning. If you lose 1/2 the amount of your daily goal, stop trading and come back tomorrow. For instance, if your goal is to make $500 a day, and you are down $250 on the day, quit for the day. This is the best way to avoid falling into a 'trading death spiral'.
![]()
link
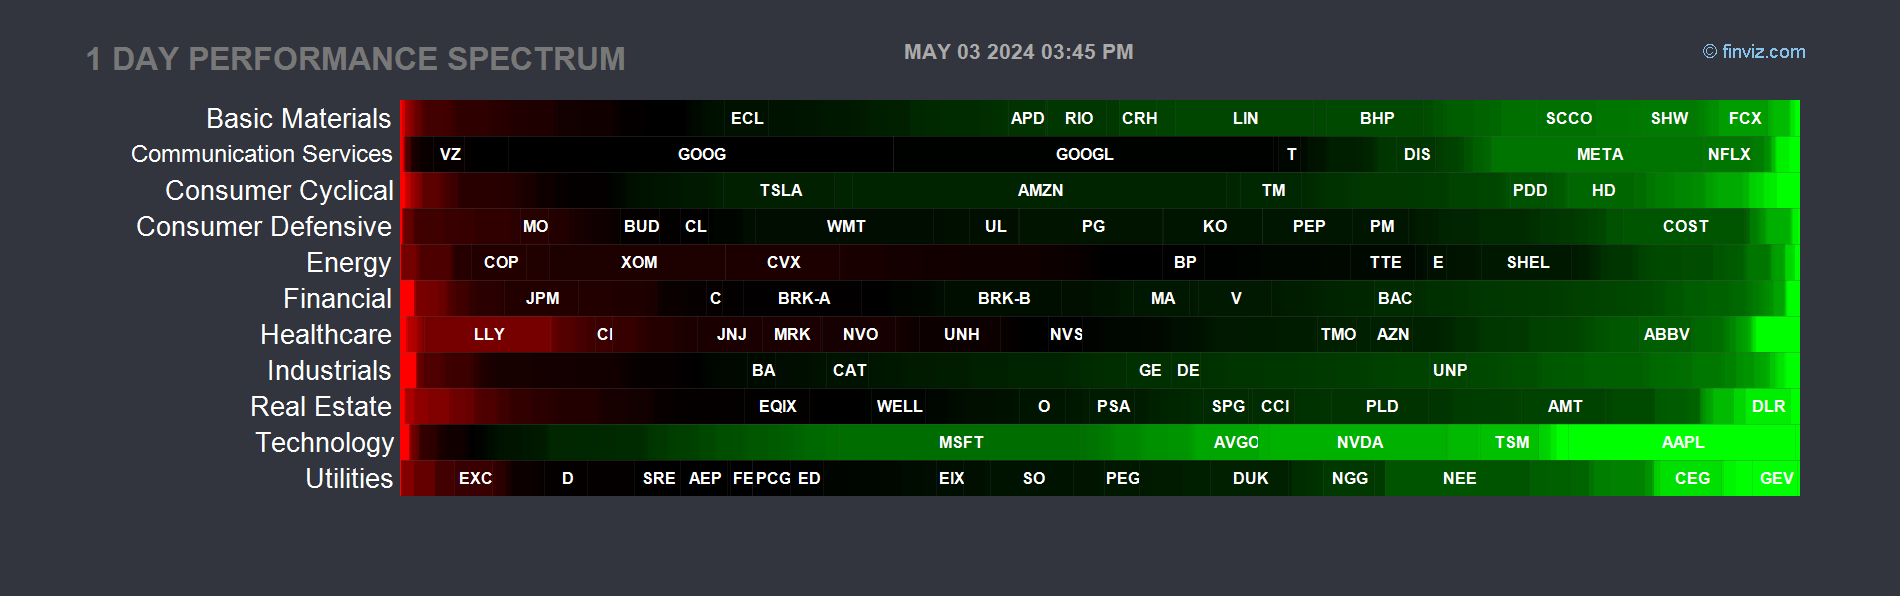
SECTORS OVERVIEW LINK http://www.finviz.com/groups.ashx?g=sector&v=210&o=name


FUTURES REALTIME http://www.forexpros.com/indices/indices-futures
FUTURES DELAY FINVIZ LINK http://bit.ly/71bS81
DOW 30 STOCKS LINKS CHARTS
WILL POST STOCK TRADES WITH ENTRIES AND STOPS WHEN TIME ALLOWS**** $$$
This board will be a Wealth of Information for you to pick and choose from
Feel Free to post info on the board with a link keep it clean and if you post a stock symbol post a chart

The Goal is to maintain a board of...:friendly ... full of info... Spam free pumping/bashing
Trading consists of two parties, therefore by definition there are two opinions equally valid. Stop bashing bears or bulls. Only bad traders
MY NAME IS https://twitter.com/#!/zozotrader
GOOD SITES FOR INFORMATION AND NEWS
http://www.theflyonthewall.com/permalinks/entry.php?
http://blogs.barrons.com/techtraderdaily/
http://blogs.barrons.com/stockstowatchtoday/
http://seekingalpha.com/news/market_currents
http://notablecalls.blogspot.com/
http://thechartpatterntrader.com/
http://theeconomiccollapseblog.com/
http://biz.yahoo.com/apf/archive.html
http://ibankcoin.com/ibc-financial-news-network/
Bloomberg Radio Link
http://www.bloomberg.com/audioplayers/playr_go.html?&clipName=Bloomberg%20Live%20Radio&clip=radio_live
BLOOMBERG TELEVISION
http://www.bloomberg.com/tv/

CNBC WATCH LIVE COVERAGE OF GLOBAL MARKETS
http://blog.livenewschat.tv/stock-traders-chat/

| Investment Philosophy | MY POSTS ARE MY OPINION..... NEVER FOLLOW ANYONE WITHOUT YOUR OWN OPINION..... TARGET/STOP LOSS |
Opinions expressed on this board are just that. Opinions. I am not a licensed broker. Trading strategies discussed on this board not suitable for everyone. If you are losing money in the market, you may wish to seek the advice of a licensed securities professional. No one is responsible for your gains or losses in the market except YOU. Please weigh the strategies discussed here carefully against what you are willing to risk. Please do your own due diligence before buying or selling ANY SECURITY in the open market, there are no guarantees.
http://stockcharts.com/h-sc/ui?s=SPY&p=D&b=5&g=0&id=p92271196310
http://stockcharts.com/h-sc/ui?s=$VIX&p=D&b=5&g=0&id=p10761674174


http://biz.yahoo.com/apf/archive.html
http://biz.yahoo.com/p/s_conameu.html
http://finance.yahoo.com/marketupdate/inplay
http://screening.nasdaq.com/heatmaps/heatmap_pmi.asp
http://screening.nasdaq.com/heatmaps/heatmap_100.asp
DOW 30 HEATMAP
http://www.stockmarketdrama.com/dow30heatmap.php
S&P 500 HEAT MAP
Futures Link
http://www.finviz.com/futures.ashx
How to post a chart with Finviz.com
You can also post a chart off http://finviz.com/quote.ashx?t=dell&ty=c&ta=1&p=d
Just right click on chart choose " copy image url"
Click the image button on left of post use "Ctrl V" or paste
so should look like this
img]http://finviz.com/chart.ashx?t=DELL&ty=c&ta=1&p=d&s=l[/img] left off a bracket so it can be seen what it will look like

FREE SITE FOR REAL-TIME CHARTS
http://www.freestockcharts.com/

FREE FLY-ON-THE-WALL SITE
http://www.theflyonthewall.com/permalinks/entry.php?
Video Chart Lessons:
Failed Fade Setup - This is one example of how we trade 'failed fade setups'.
http://www.greatstockpix.com/Failed%20Fade%20Setup/Failed%20Fade%20Setup.htm
Trading Death Spiral - Here, we talk about controlling emotions and trading correct size.
http://www.greatstockpix.com/trading%20death%20spiral/trading%20death%20spiral.htm
STOCKCHART SETUPS FOR IHUB HOW TO USE JUST REPLACE THE *** AND PUT IN A STOCK SYMBOL ADD a BRACKET [ at the FRONT chart] AND YOUR CHART WILL APPEAR
4 month chart small
chart]stockcharts.com/c-sc/sc?s=***&p=d&yr=0&mn=4&dy=0&id=p27435460163[/chart]
6 month Mint chart little bigger
chart]stockcharts.com/c-sc/sc?s=***&p=D&yr=0&mn=9&dy=0&i=p37531278942&r=9525[/chart]
6 month -- Mohave: has 20 ma 50ma and 200ma
chart]stockcharts.com/c-sc/sc?s=***&p=D&yr=0&mn=6&dy=0&i=p23472481093&r=6053[/chart]
4 month -- Mohave:
chart]stockcharts.com/c-sc/sc?s=***&p=D&yr=0&mn=4&dy=0&i=p30849305698&r=8873[/chart]
3 year WEEKLY chart:
chart]stockcharts.com/c-sc/sc?s=***&p=W&yr=3&mn=6&dy=0&i=p19678537033&r=5437[/chart]
Weekly HISTORICAL: 3yr. 50-200ma...RSI - MACD - CMF - PRICES - VOLUME - BLACK BACKGROUND.
chart]stockcharts.com/c-sc/sc?s=***&p=W&yr=3&mn=0&dy=0&i=p22053646375&r=[/chart]
5 MONTH CHART SET UP BLUE EDGE
chart]stockcharts.com/c-sc/sc?s=***&p=D&b=5&g=0&i=t14235047338&r=3924[/chart]
FINVIZ.COM FUTURES
http://finviz.com/futures_charts.ashx?p=m5
Charting tools
http://www.stockcharts.com
http://www.chartpatterns.com
http://stockcharts.com/education/IndicatorAnalysis/
http://www.investopedia.com/categories/technicalanalysis.asp
http://www.candlesticker.com/Default.asp
http://candlestickforum.com/PPF/Parameters/16_332_/candlestick.asp
http://www.incrediblecharts.com/technical/candlesticks.htm
http://www.chartpatterns.com/
http://www.investopedia.com/university/technical/techanalysis8.asp
http://stockcharts.com/school/doku.php?id=chart_school:technical_indicators

ODDS AND ENDS
http://www.alphatrends.blogspot.com/
http://www.earningswhispers.com/


![]()
SCREENER BY INDUSTRY
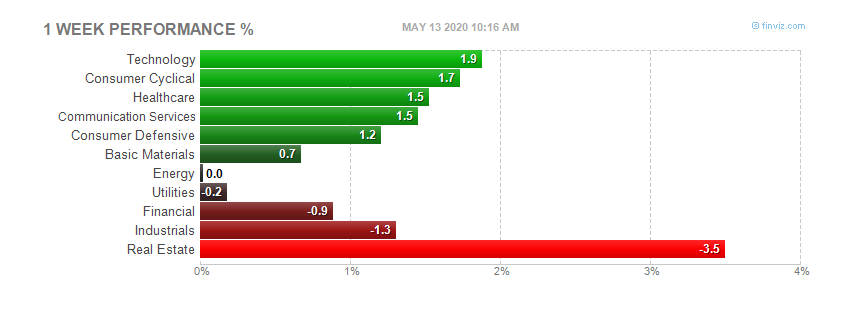
http://www.finviz.com/groups.ashx?g=industry&v=140&o=-perf1w
THE END !!!!!

MY FREE ROOM ON PALTALK
http://express.paltalk.com/index.html?gid=1456220619
|
Posts Today
|
0
|
|
Posts (Total)
|
7190
|
|
Posters
|
|
|
Moderator
|
|
|
Assistants
|
| Volume | |
| Day Range: | |
| Bid Price | |
| Ask Price | |
| Last Trade Time: |


