News
News  Market Data
  Discover
Support: 888-992-3836
Copyright © 2023 InvestorsHub Inc.


Register for free to join our community of investors and share your ideas. You will also get access to streaming quotes, interactive charts, trades, portfolio, live options flow and more tools.
Tag, you're it. You get into crypto yet? Lol
Imagine That LOL
9 years later....
$DSCR: Global Hemp Revolution - Decriminalize Cannabis Marijuana Industrial Hemp for Victory!
$DSCR: Run From the Cure - Rick Simpson (Hemp Oil Cancer Treatment)
$DSCR: Global Hemp Revolution - Decriminalize Cannabis Marijuana Industrial Hemp for Victory!
ONVO 7.78 --3D bioprinting.. print human kidney!
Whats going on these days?????? how are u???
RGDX Some decent news,PPS responding well to it.
Taking a small break,loaded up on OPK and RMTI March calls.
CPRX 52% jump..
PBMD getting a little bit of love today..
#420 Fer-U And #125 For The-Board 
CPRX.. Skidoosh...
CPRX looking good..
Looking for one more week of consolidation then market going for a Bull ride.
Just my opinion
BRACE YOUR SELVES IF THIS TURNS TO BE TRUE!
https://www.facebook.com/notes/wealthbuilders-traders-conceptstrategies/possible-major-bull-market-run-on-the-horizon/573044259405511
Looking for a 10% correction this week but a few things need to happen.
http://stockcharts.com/h-sc/ui?s=CMI&p=D&yr=0&mn=9&dy=0&id=p24020075212
I hope ya got some.
Seems like PVA make it down to $4.20... and headed up now. 
Up i say.....whip
There's always tomorrow...
I'll split the difference from your 4.20 and my 4.80....4.52 PVA lol lol
PVA 67% NG 33% Oil
$4.20 to $4.40 still possible...
|
Followers
|
105
|
Posters
|
|
|
Posts (Today)
|
0
|
Posts (Total)
|
4247
|
|
Created
|
04/23/10
|
Type
|
Free
|
| Moderator Geaux Fish | |||
| Assistants Day Trdr Belle Tina sonicwedgie Hawks_Stocks | |||


60 Min 30 day line charts
1 Year line charts
Ticker Cloud link below is a list of the 200 most popular stocks on StockCharts.com right now based on intraday chart requests during the past 15 minutes. The larger the symbol, the more popular the stock. Click on any ticker symbol to see a SharpChart of that stock.
http://stockcharts.com/charts/tickercloud.html
Murphy's laws of technical trading
By John Murphy
http://investorshub.advfn.com/boards/read_msg.aspx?message_id=49381452
20 GOLDEN RULES FOR TRADERS
http://investorshub.advfn.com/boards/read_msg.aspx?message_id=49381474
Market tool web sites of great use:
http://www.fibonacci-retracements.com/ ---- http://www.ddmachine.com/default.asp ----- http://www.americanbulls.com/Default.asp ---- http://shortsqueeze.com/ ---- www.candlestickgenius.com
Market 3D view by sectors: Awesome tool http://finviz.com/map3d.ashx
Investopedia.com: http://www.investopedia.com/UNIVERSITY/TECHNICAL/
Trading Tools, Brokers, L2 Service - http://www.scottrade.com/ -- https://us.etrade.com/e/t/home -- https://www.fidelity.com/ -- http://www.tdameritrade.com/offer/independence.html?a=vqm
https://www.zecco.com/trading/signup.aspx -- http://www.choicetrade.com/ -- https://www.just2trade.com/index.php -- http://www.sharebuilder.com/sharebuilder -- http://www.schwab.com/
http://www.fxcm.com/ -- http://www.forex.com/index.html -- http://www.level2trader.com/ -- http://www.questrade.com/trading/stocks_questraderpro.aspx -- http://www.nobletrading.com/
L2 Services: http://www.alphatrade.com/ ---- http://www.quotemedia.com/
EquityFeed : http://www.equityfeed.com/
News sites:
http://www.businesswire.com/ ***http://primenewswire.com/***http://finance.google.com/finance***http://www.marketwatch.com/***http://www.thestreet.com/***http://www.cnbc.com/***http://online.wsj.com/public/us***http://www.forbes.com/
http://www.ap.org/ ***http://www.bizjournals.com/ ***http://www.fool.com*** http://www.bloomberg.com/index_americas.html
Black Monday (1987)
http://en.wikipedia.org/wiki/Black_Monday_%281987%29
Paying my tuition in the stock market: http://investorshub.advfn.com/boards/read_msg.aspx?message_id=30655121
IHUB Frequently Asked Questions: http://ihwiki.advfn.com/index.php?title=Frequently_Asked_Question
Example on how to post Ziggy,s and Charts: http://investorshub.advfn.com/boards/read_msg.aspx?message_id=49381993
![]()
GeauxFish
LIVE CHART EXAMPLES with settings: By GeauxFish you will need stock chart subscription to view.
10 Min 2 Day Trading basic 10 min Chart set above example: http://stockcharts.com/h-sc/ui?s=AMZN&p=10&yr=0&mn=0&dy=2&id=p33573220915&a=209351104
10 Min 3 Day Trading live Chart example: http://stockcharts.com/h-sc/ui?s=FAZ&p=10&yr=0&mn=0&dy=3&id=p30510560197&a=204833009
30 Min 7 Day live chart example: http://stockcharts.com/h-sc/ui?s=FAZ&p=30&yr=0&mn=0&dy=7&id=p08741698138&a=207401715
ANNOTATE CHART EXAMPLES:
6 Month Daily Chart example: http://stockcharts.com/h-sc/ui?s=BC&p=D&st=2009-03-01&en=2009-09-08&id=p60886391083&a=198109750
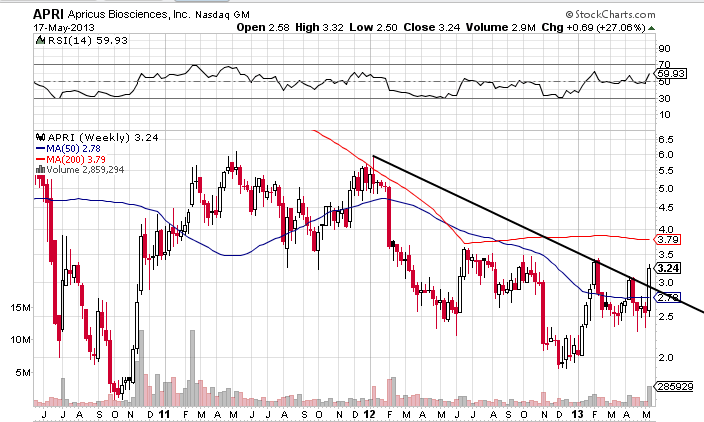
2 Year Weekly Chart example of a bottom in a bullish market or stock breaking out of jail off bottom for the long term.
http://stockcharts.com/h-sc/ui?s=SMRT&p=W&st=2008-07-01&en=2010-04-16&id=p62947284080&a=198008888
http://stockcharts.com/h-sc/ui?s=CAR&p=W&st=2008-07-01&en=2010-04-16&id=p19227327713&a=199310935
http://stockcharts.com/h-sc/ui?s=KIRK&p=W&st=2008-07-01&en=2010-04-16&id=p59106015941&a=206422509
Natural Gas Chart link: http://stockcharts.com/h-sc/ui?s=$NATGAS&p=D&yr=0&mn=6&dy=0&id=p93596435682&a=198405486
Oil Light Crude Chart link: http://stockcharts.com/h-sc/ui?s=$WTIC&p=D&yr=0&mn=6&dy=0&id=p97978634005&a=198405551
Candle charting:
http://www.candlestickgenius.com/candlesticksqueeze/candlestick_squeeze_system.pdf
Stock learning Technical Analysis info you can use like below or links below with descriptions
http://stockcharts.com/school/doku.php?id=chart_school
Technical Analysis is the forecasting of future financial price movements based on an examination of past price movements. Like weather forecasting, technical analysis does not result in absolute predictions about the future. Instead, technical analysis can help investors anticipate what is "likely" to happen to prices over time. Technical analysis uses a wide variety of charts that show price over time.
Technical Indicators are the often squiggly lines found above, below and on-top-of the price information on a technical chart. Indicators that use the same scale as prices are typically plotted on top of the price bars and are therefore referred to as "Overlays."
This section describes the various kinds of technical indicators and overlays that are available here at StockCharts.com.
This section describes the various kinds of financial charts that we provide here at StockCharts.com. There are articles that describe how the charts are constructed and how they can be used to make better investing decisions.
![]()
DISCLAIMER:
Wealth Builders Traders Paradise market strategies is not responsible for any loss or gains that a trader may acquire. You as an individual, groups or corporations agree not to hold Wealth Builders Traders Paradise themselves, persons or associated leaders liable for trading losses, lost profits or other damages resulting from your use of information. The Information is considered as informational proposes. Wealth Builders Traders Paradise does not verify or will guarantee the suitability or profitability of any types of investment. You as a trader risk of loss in trading securities, options and index futures can be substantial. Individual traders should carefully consider whether such trading is suitable for your financial criteria. You the trader, individuals, groups or corporations take full responsibility for your own investment actions, research and decisions and should seek registered licensed professional advice of a qualified securities broker / market analyst before making any investment decisions and you agree to indemnify and not hold Wealth Builders Traders paradise from and against any and all claims, losses, liabilities, costs, and expenses arising from your trading actions as individuals, groups or corporations.
Wealth Builders Traders Paradise is not registered as a securities broker-dealer or an investment adviser either with the U.S. Securities and Exchange Commission (the "SEC") or with any state securities regulatory authority. Wealth Builders Traders Paradise are neither licensed nor qualified to provide investment advice.
Wealth Builders Traders Paradise advises investors too carefully read investment information available at the websites of the SEC at http://www.sec.gov/ and FINRA at http://www.finra.org/
|
Posts Today
|
0
|
|
Posts (Total)
|
4247
|
|
Posters
|
|
|
Moderator
|
|
|
Assistants
|
| Volume | |
| Day Range: | |
| Bid Price | |
| Ask Price | |
| Last Trade Time: |