 News
News  Market Data
  Discover
Support: 888-992-3836
Copyright © 2023 InvestorsHub Inc.


Register for free to join our community of investors and share your ideas. You will also get access to streaming quotes, interactive charts, trades, portfolio, live options flow and more tools.
APPY on major breakout watch ahead.
TVIX- Chart
[chart]stockcharts.com/c-sc/sc?s=TVIX&p=D&yr=1&mn=0&dy=0&i=p17849516122&a=441098528&r=1453330110363[\chart]
new to the board. love candlesticks. my favorite is the Bullish and bearish engulfing candle. Love hammers too but they need to come at tops or bottoms.
Glad I found this board.
DC
NAVB - Daily Candlesticks-reconranger
PLX - Weekly Candlesticks-reconranger
RGEN - Weekly Candlesticks-reconranger
BPAX - Daily Candlesticks-reconranger
Ranger Runners watchlist -reconranger
Then repeat: Each group makes one line, space, then next group.
Then repeat: Each group makes one line, space, then next group.
[*img]stockcharts.com/c-sc/sc?chart=drys,uu[m,a]daclyiay[db][pb50!b200!b9!b14!b5!f!d!][iut!lh14,3!li14,3!lo14!ue12,26,9!ul14][vc10!c20!c50][j30525747,y]&r=7623[/img][*img]stockcharts.com/c-sc/sc?chart=egle,uu[m,a]daclyiay[db][pb50!b200!b9!b14!b5!f!d!][iut!lh14,3!li14,3!lo14!ue12,26,9!ul14][vc10!c20!c50][j30525747,y]&r=7623[/img]
[*img]stockcharts.com/c-sc/sc?chart=drys,uu[m,a]daclyiay[db][pb50!b200!b9!b14!b5!f!d!][iut!lh14,3!li14,3!lo14!ue12,26,9!ul14][vc10!c20!c50][j30525747,y]&r=7623[/img][*img]stockcharts.com/c-sc/sc?chart=egle,uu[m,a]daclyiay[db][pb50!b200!b9!b14!b5!f!d!][iut!lh14,3!li14,3!lo14!ue12,26,9!ul14][vc10!c20!c50][j30525747,y]&r=7623[/img]
[*img]stockcharts.com/c-sc/sc?chart=drys,uu[m,a]daclyiay[db][pb50!b200!b9!b14!b5!f!d!][iut!lh14,3!li14,3!lo14!ue12,26,9!ul14][vc10!c20!c50][j30525747,y]&r=7623[/img][*img]stockcharts.com/c-sc/sc?chart=egle,uu[m,a]daclyiay[db][pb50!b200!b9!b14!b5!f!d!][iut!lh14,3!li14,3!lo14!ue12,26,9!ul14][vc10!c20!c50][j30525747,y]&r=7623[/img]
[*img]stockcharts.com/c-sc/sc?chart=ctic,uu[m,a]daclyiay[db][pb50!b200!b9!b14!b5!f!d!][iut!lh14,3!li14,3!lo14!ue12,26,9!ul14][vc10!c20!c50][j30525747,y]&r=7623[/img][*img]stockcharts.com/c-sc/sc?chart=drys,uu[m,a]daclyiay[db][pb50!b200!b9!b14!b5!f!d!][iut!lh14,3!li14,3!lo14!ue12,26,9!ul14][vc10!c20!c50][j30525747,y]&r=7623[/img][*img]stockcharts.com/c-sc/sc?chart=egle,uu[m,a]daclyiay[db][pb50!b200!b9!b14!b5!f!d!][iut!lh14,3!li14,3!lo14!ue12,26,9!ul14][vc10!c20!c50][j30525747,y]&r=7623[/img]
[*img]stockcharts.com/c-sc/sc?chart=spwr,uu[m,a]daclyiay[db][pb50!b200!b9!b14!b5!f!d!][iut!lh14,3!li14,3!lo14!ue12,26,9!ul14][vc10!c20!c50][j30525747,y]&r=7623[/img][*img]stockcharts.com/c-sc/sc?chart=drys,uu[m,a]daclyiay[db][pb50!b200!b9!b14!b5!f!d!][iut!lh14,3!li14,3!lo14!ue12,26,9!ul14][vc10!c20!c50][j30525747,y]&r=7623[/img][*img]stockcharts.com/c-sc/sc?chart=egle,uu[m,a]daclyiay[db][pb50!b200!b9!b14!b5!f!d!][iut!lh14,3!li14,3!lo14!ue12,26,9!ul14][vc10!c20!c50][j30525747,y]&r=7623[/img]
[*img]stockcharts.com/c-sc/sc?chart=opwv,uu[m,a]daclyiay[db][pb50!b200!b9!b14!b5!f!d!][iut!lh14,3!li14,3!lo14!ue12,26,9!ul14][vc10!c20!c50][j30525747,y]&r=7623[/img][*img]stockcharts.com/c-sc/sc?chart=drys,uu[m,a]daclyiay[db][pb50!b200!b9!b14!b5!f!d!][iut!lh14,3!li14,3!lo14!ue12,26,9!ul14][vc10!c20!c50][j30525747,y]&r=7623[/img][*img]stockcharts.com/c-sc/sc?chart=egle,uu[m,a]daclyiay[db][pb50!b200!b9!b14!b5!f!d!][iut!lh14,3!li14,3!lo14!ue12,26,9!ul14][vc10!c20!c50][j30525747,y]&r=7623[/img]
WCRX - Daily Candlesticks-reconranger
SPLS - Daily Candlesticks-reconranger
POT - Weekly Candlesticks-reconranger
Is it possible to get a weekly on POT?
ART - Weekly Candlesticks-reconranger
GNOM - Weekly Candlesticks-reconranger
JBII - Weekly Candlesticks-reconranger
MDHI - Weekly Candlesticks-reconranger
ELX - Weekly Candlesticks
UNG - Weekly Candlesticks-reconranger
UNG - Daily Candlesticks-reconranger
|
Followers
|
19
|
Posters
|
|
|
Posts (Today)
|
0
|
Posts (Total)
|
596
|
|
Created
|
08/21/09
|
Type
|
Premium
|
| Moderator reconranger | |||
| Assistants learning as I go | |||

Swing-Trade
For our RANGER RUNNERS -Traders we will focus on stocks with Candlestick bullishish patterns. This board is for TA plays.
We use cash management tools to keep us in the game. We utilize stops, trailing stops, and feed-in entries to take advantage of stock movements. All of which are designed to make our readers money…and to mitigate market losses/expenses.
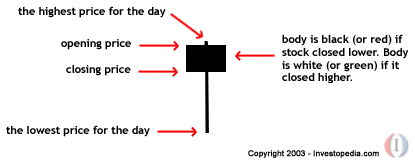
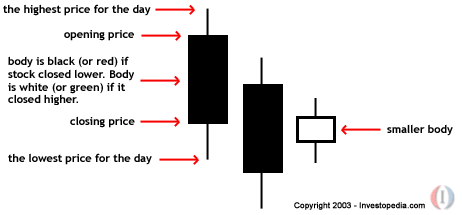
What are Japanese Candlesticks?
Japanese candlesticks are a valid, effective and popular form of technical analysis.
A Japanese chart can show investor sentiment, trading trends, and much more.
Japanese Candlestick Analysis
As a form of technical analysis, a Japanese chart and candlestick pattern analysis will help anyone who wishes to have another tool at their disposal; a tool that will help sort and control the constant disruptions and continued outside influences to sound stock, futures, and Forex market analysis.
What does a Japanese chart offer that typical Western high-low bar charts do not? As far as actual data displayed — nothing. However, when it comes to visual appeal and the ability to see data relationships easier, candlesticks on a Japanese chart are exceptional. It reveals quick insight to the recent trading psychology and investor sentiment. After a minimal amount of practice and familiarization, Japanese candlesticks will likely become part of your technical analysis methods.
Japanese candlesticks offer a quick picture into the psychology of trading, studying the effect, not the cause. This places Japanese candlesticks squarely into the category of technical analysis. We cannot ignore the fact that prices are influenced by trader's psychologically driven emotions of fear, greed, and hope. Some form of technical analysis must be used to analyze the changes in these psychological factors. Japanese candlesticks read the changes in the makeup of trader's interpretations of value, otherwise known as investor sentiment. This is then reflected in price movement. Japanese candlesticks show the interaction between buyers and sellers. A Japanese chart provides insight into the financial markets that is not readily available with other charting methods. It works well with stocks, commodities, and Forex.
This introduction to Japanese candlestick charting and technical analysis will also provide information of the usefulness of Japanese candlestick patterns as a technical analysis tool. All methods of technical analysis and all assumptions will be open and visible. You will either begin to use candlesticks and a Japanese chart to assist in your market analysis and timing or be confident enough in them to further your own research into Japanese candlestick technical analysis.
CHART PATTERNS PLAYS SETUPS
Candlestick Morning Star
The Morning Star Pattern is a three candle pattern at the bottom of a downtrend. This is the bull reversal opposite of the Evening Star.The body of the first candle is black, confirming the current downtrend. The second candle is an indecisive formation. This is the “star” of the formation and the trading range should be small for the day.It could be black or white.White is a stronger indication. The third candle is white and should close at least halfway up the black candle.
Rules:
The downward trend has been fairly consistent for a period of time.
The body of the first candle is black, continuing the current trend.
The second candle is an indecision formation. The "Morning Star".
The third day shows evidence that the bulls have taken control. The white candle should close at least halfway up the black candle.
Signal Strengtheners:
The longer the black candle and the white candle, first and third days, the stronger the reversal.
The more indecision that the star day shows, the better chance that a reversal will occur.
A Gap between the first day and the star day adds to the chance that a reversal is occurring.
A gap before and after the star day is even more indicative of a reversal.
The magnitude that the third day comes up into the black candle of the first day, indicates the strength of the reversal.
General Analysis:
The market trend was on its way down. The stronger the downtrend, the more investor sentiment changes to fear of the end of the trend. The sellers start getting nervous and create a large sell-off day, closing their positions. The next day the buyers start buying at the low prices. Larger volume during these days shows that ownership of the trend has changed hands. The star day does not have a large trading range as buyers and sellers are swapping positions. The third day the bulls take complete control and bears start to lose confidence. The price moves back into the trading range of the first day and the bears give up giving the bulls full control.
Candlestick Hammer Signal
A very important signal is the Hammer signal. It is extremely easy to spot since it really does look like a hammer. Okay, perhaps an old wooden hammer or mallet. Basically, the body is fairly square, there is little or no wick on top, and the lower shadow is generally at least twice the length of the body.
The Hammer is a single candle. At the bottom of a downtrend, the trade opens near or slightly below the previous days trade, drops down during the day to some value, and closes slightly above or below the open. This is an indication that the buyers are stepping in and may be the beginning of the reversal. If the close is higher than the open, this is a slightly stronger indication of a reversal than if the close is lower than the open. To be sure, it is wise to wait another day to make sure the trend has really reversed.
Rules:
The lower shadow should be at least two times the length of the body..
The real body is at the top end of the trading range. While a white body is slightly stronger, it is not required to signal the reversal.
There should be little or no upper wick.
Watch the next day to ensure the reversal is not a “fake”.
Signal Strengtheners:
The longer the lower shadow, the higher probability of a reversal.
A gap below the previous day’s close indicates a stronger reversal if the following day after the Hammer opens higher.
Large volume trading on the Hammer day indicates that the reversal is occurring.
General Analysis:
The market trend was on its way down. The price opens and starts moving down as investor sentiment is still in sell. The buyers step in and start pushing the price back up, thinking they have hit the low end and its time to buy. The price moves back up to the top of the trade range, closing either slightly below or slightly above the opening. This shows the sellers could not maintain control and the downtrend is slowing down. The upward rally of the price starts the sellers thinking that the decline is over. If the next day opens higher, this indicates the sellers have given control back to the buyers, and the reversal is likely to be continued.
Three White Soldiers Pattern
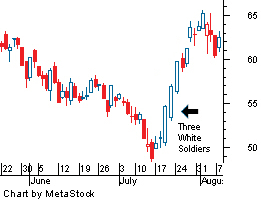
In a downtrend three long white days occur with consecutively higher closes.Generally the Three White Soldiers signal suggests future market fortitude,as a reversal is in progress that is building on moderate upward steps.Three White Soldiers is a three candle bullish reversal formation and is the opposite of Three Black Crows. This pattern occurs in a downtrend where three consecutive white bodies occur in sequence, each with a higher close. Each should open within the previous body and the close should be near the high of the day.
Rules:
The downward trend has been fairly consistent for a good period of time.
The first candle is in the opposite direction of the trend (a white candle).
The second and third candlesticks are white and open in the previous day's body.
Each day should close very near its high for the day.
The opens should be within the top half of the previous day's body.
Signal Strengtheners:
General Analysis:
After a downtrend or a flat period, this pattern suggests an uptrend rally will occur. The strength of this formation consists of the fact that each day, the lower open suggests that the Bears are still present. By the end of each day, the Bulls have overcome the early period Bears. This indicates that a continued rally has selling occurring as it is happening. If there is large trade volume during this period, it is likely that positions are changing hands and a continued rise should be seen, especially in an oversold market.
The longer the candles, the more dramatic the reversal.
The higher a candle opens compared to the prior candle, the stronger the chance of a continued reversal.
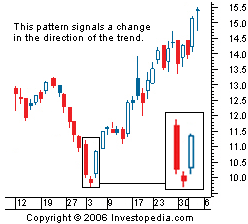
Candlestick Engulfing Signal
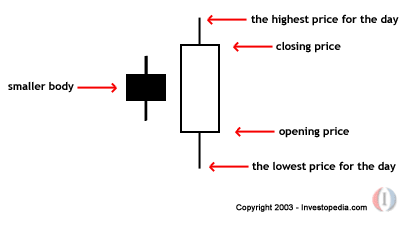
This has been proven to be a very high probability reversal signal over hundreds of years. We will break down the individual pieces of the bullish engulfing signal and show you how investor sentiment can cause a reversal. The Bullish Engulfing pattern contains two opposite colored bodies and indicates a major reversal pattern.As you can see, the previous trend was downward. The Bullish Engulfing Pattern opens lower than the previous day’s close, but closes higher than the previous day’s open. Notice how the Bullish Engulfing Signal completely “engulfs” the previous day’s body.
Rules:
The body of the second day completely engulfs the body of the first day. Ignore the wicks/shadows.
Previous bars have been in a definitive downtrend, even if short term.
The first candle in this pattern is the same color as the previous trend (with the possible exception of being a DOJI or an extremely small body).
The second candle is the opposite color of the first (i.e. reversal of the trend)
Signal Strengtheners:
If the Engulfing Signal is a large body and engulfs a very small body from the previous day, it shows the trend was slowing. The large body Engulfing Signal indicates the new direction (reversal) has started with strength.
If the downtrend was fast and furious, when the reversal hits there will be less resistance to the move up, thus increasing the profit potential.
While you ignore the shadows for determining if the signal is indeed a Bullish Engulfing Signal, if the body of the engulfing signal completely encompasses the upper and lower shadows of the previous day, it shows extremely strong support for the reversal to continue.
The larger gap created between the open from the engulfing signal from the previous close, the greater the chance of a strong reversal.
The Bullish Engulfing Pattern is confirmed by a third white candlestick, with a higher close than the second day.
This is the Three Outside Up signal.
General Analysis:
The market trend was on its way down. The price opens lower than where it closed the previous time frame. By the end of the time frame, the buyers have come out in force and moved the price above where it opened the day before.Suddenly investor sentiment sees the trend has been changed. The Bullish Engulfing Pattern represents the reversal of the downward trend investor sentiment. Using this pattern as a buy signal is generally profitable because the Bullish Engulfing Pattern has signaled that the buyers are ready to buy.
The Bullish Harami Pattern
The Bullish Harami is a two candle pattern forming in a down trending price pattern. The body of the first candle is the same color as the current trend and should be a long black candle.The body of the second candle is white and opens and closes within the body of previous day's candle.
Rules:
The down trend has been fairly consistent for a period of time. A long black candle occurs at the end of the trend.
The body of the first candle is black, the body of the second candle is white.
The second day opens higher than the close of the previous day and closes lower than the open of the prior day. (i.e. the body of the second candle is contained entirely within the body of the first candle).
Further confirmation is required to indicate a reversal signal. The Bullish Harami Pattern is a good indication of a possible reversal, pending confirmation. Wait another day. A confirmation may come in the form of a Three Inside Up pattern.
Signal Strengtheners:
The longer the black candle and the white candle, the more potential of a reversal occuring.
The higher the white candle closes up on the black candle, the more likely that a reversal has occurred despite the size of the white candle.
The higher volue during the Harami days, the more likely a reversal is occuring due to swapping positions.
General Analysis:
After a strong downtrend the Bulls step in and open the price higher than the previous day's close. This concerns the Bears and the shorts start covering their postions.The price finishes higher for the day. A strong day after that would be key that the trend may be in a reversal.
Candlestick Bullish Kicker Signal

The Bullish Kicker Signal is a two candle pattern.The first candle opens and moves in the direction of the current down trend. Usually with little or no upper or lower wick. The second candle opens at the same open of the first candle, or is gapped up, and moves in the opposite direction.
Rules:
he first day’s open and the second day’s open are the same. The price movement is in opposite directions from the opening price.
The price never retraces into the previous day's trading range.
The signal usually occurs due to surprise news that affects investor sentiment.
Trend is usually irrelevant for the Kicker signal.
Signal Strengtheners:
The longer the candles, the more dramatic the reversal.
The second day opening at the same point as the first day's opening instead of near it's closing is a gap up from the first day's closing price.
Gapping up from the first day’s open further increases the probability of the reversal.
General Analysis:
The Kicker signal demonstrates a dramatic change in investor sentiment. Something has occurred to suddenly change the direction of the price. Usually a surprise news item is the cause of this type of move since it changes investor psychology toward the news item.The signal indicates the new direction will likely persist with strength for a while because of the new investor sentiment created.
However, if you use this signal to go long and then the next day prices gap back the other way, close out the trade
Introductions to Candlesticks!
stockcharts.com/school/doku.php
What is needed?
Moving Average Convergence Divergence (MACD) indicator
o
Default setting of 12,26,9 is normally used, but it can be varied
Ability to identify resistance levels
8 period simple moving average
What must happen?
1. Bullish MACD crossover (most explosive moves come when this occurs below the zero line)
2. You must then identify the nearest resistance level (usually a previous high or low)
3. Put on your MACD Buster watchlist
** IMPORTANT **
4. When the price closes above the marked resistance point, you have the green light!
- No further actions should take place until #4 occurs
What to do?
5. Place a limit order at your marked resistance point (which is now a support level).
6. When your order is filled, use the 8 period simple moving average as stop-loss. Gradually take profits on the way up.
7. Trade ends when the 8-SMA IS VIOLATED.
|
Posts Today
|
0
|
|
Posts (Total)
|
596
|
|
Posters
|
|
|
Moderator
|
|
|
Assistants
|
| Volume | |
| Day Range: | |
| Bid Price | |
| Ask Price | |
| Last Trade Time: |


