 News
News  Market Data
  Discover
Support: 888-992-3836
Copyright © 2023 InvestorsHub Inc.


Register for free to join our community of investors and share your ideas. You will also get access to streaming quotes, interactive charts, trades, portfolio, live options flow and more tools.
crazy horse. I just went "Unpaid" and I think you might want to post the infor below on "America First". Just found the info, you can use me wow_happens if you want. I see this is a dead board.
https://investorshub.advfn.com/boards/read_msg.aspx?message_id=163829560
To RENKO Stockchart users.
I do not yet use Stockcharts. So my querie is In Stockcharts, in setting up a scan can one specify the type of Chart against which to run the scan. i.e. run the scan for stocastic setups but the stoc. is drawn using Renko data ? Thanks for your reply.
UAMM~start with this one. Good one to get your feet wet.
Simple, My Friend!
Since I got banned the board has been dead, I bring passion!
I make money trading 4X and credit that to my passion for charting.
I have rolled 3 practice accounts starting at 10k to 100k in less than a month each time.
Created the most simple method using 1H charts that works!
God Bless!
Miss working with you..
I have started using the "pinch" for buy signals but am still hunting something similar for sell signals. Any suggestions?
I'm trying to learn Renko charts and use them for swing trading ETFs and CEFs. My initial question is why would I want to use ATR14 instead of say ATR3? My second question is what other indicators would be most useful with Renko charts for daily and weekly charts? I am currently limited to the free charts from Stock Charts and other sites.
Thanks for the reply Renkoron I am a big fan of your work. I also swing trade using very similar chart settings but use weekly charts instead of daily charts to cut down on whipsaws. I also use CCI-20 for confirmation on trades. Check out "All Allen"'s blog for some good Renko ideas (also uses the CCI-20 trade confirmation).
jwitko, I do not know of any backtesting on RENKO charts. I use Stockcharts for my charts. Manual backtesting is all I know. My style is swing trading on longer periods. No activity on the board. It is a shame. i switch between RENKO and PNF. I like PNF for easy changing dates and look back. Ron
http://stockcharts.com/h-sc/ui?s=BGU&p=W&yr=0&mn=2&dy=0&id=p63699736851
http://stockcharts.com/h-sc/ui?s=$SPX&p=M&yr=10&mn=0&dy=0&id=p27106486006&a=152510272
http://stockcharts.com/h-sc/ui?s=$SPX&p=M&yr=1&mn=0&dy=0&id=p24585722682&a=176357657
http://stockcharts.com/h-sc/ui?s=$SPX&p=D&yr=0&mn=2&dy=0&id=p34744971040&a=153730981
Can anyone recommend how to run Renko chart backtesting? Any recommended chart services, can this be done at Stockcharts.com?
Renkoron
Thanks for the reply. Are there any more active renko sites that arn't all about forex? Stockcharts.com seems to be the only site with free renko charts, I'm trying to decide if it's worth the subscription to get the shorter time frames and chart layout storage ect.
duke, Not much action here as you can see. It is a shame. Ron
Hi I'm new to this board and interested in Renko charts. Is this renko thread dead?
I'm new but from all I've learned, yes, you have a valid entry as of the most recent open box using a daily chart. Using a 60 minute chart, it is not yet a valid entry.
Probably should mention this is using the parameters prescribed in the site's "how to" video ... excellent video by the way.
Hope this helps.
Entering a Trade using the Renko system
After getting a buy signal, is this system like other trend trading where you may consider an entry at any point regardless how my boxes the price has run up? Is this where normal resistance points (200dma, etc.) as well as previous renko highs come into the decision making?
Appreciate the feedback.
Can any of you renko experts give me an opinion on (ABK). It looks like a buy. Thanks
Crossed over the 7 EMA
PSAR is triggered 0.09,0.2
Full STO is crossed over 20
http://stockcharts.com/h-sc/ui?c=ABK,uu[h,a]daclyyay[pb50!b200!f][vc60][iue12,26,9!lc20]
Hey soapy - can u put this in the ibox where my other chart used to be?
thx
The intraday model buy on FAZ yesterday turned out to be just right, not too cold and not too hot. The limit order to sell (at 22% profit level) has just been cancelled and will be re-entered at a higher profit level at the end of the day providing the trend does not look long in the tooth. The theory for putting in limit orders to sell above price at the end of the day is to capture pops in price that often happen at market opens. As the trend becomes older, those (above price) sell orders will be replaced with trailing stop orders. The theory is that this process increases the probability of capturing the majority of the trend. This is a new system, so we'll see.
renkoron,
the only thing I've accomplished on Renko is working with QuoteTracker to get them to correct the way they calculate their Renko chart. Since I was the only one to notice they were doing it wrong, perhaps I earned a few brownie points; so, after everything was fixed, I made suggestions for new features, such as brick size based on % of price, and brick size based on % of ATR. We'll see what happens in due time.
Meanwhile, I'm looking at the Renko calculation as a means of filtering daily data to minimize daily trading noise, then I'm going to add the filter to my existing Daily Trend Model (DTM) to see if it improves results during backtests. For instance, instead of candles showing OHLC data, I'll generate new "candles" with only HL data (no tails, just a body) wherein the candle body size is determined by Renko rules applied to daily HL price data, then I'll plot that on a standard candlestick chart, as opposed to a Renko chart. The result will be a candle chart just like any other candle chart except the candles will not have tails and the body sizes will be integer multiples of brick sizes ... if you know what I mean. The old DTM has been working very well when the market is trending, but it works poorly when the market is in consolidation phase (such as it has been for two months now). So, my goal is to make a new DTM that works better in sideways markets.
But I got distracted. Setting aside the DTM improvement for a while, I started working on a new intraday trading model. For that, I am not interested in Renko. I am very interested in using VWAP in conjunction with EVWMA(0.2) to time the trade on a 15m chart under preconditions determined by some combination of coincident indicators selected from TMF, SMI, UO, and RSI. Based on my thoughts there, today I acquired a real position in FAZ as a hedge against UYG. I also entered a multi-day limit order to close FAZ for a 22% gain. Now I can go outside and let the market take its natural course.
I would have replied sooner but you didn't address the message to me so it didn't show up in my Mailbox, and I haven't been over to this board for a while. Hope you are doing well.
Hey Soapy, could you hook me up with a renko chart for MTIZ? I think we got something good going here.
SGLS 15 min renko should have a bounce 006 now
FAZ~FAS-default settings,around 3%.Nevermind about these posts I'm just trying to figure out the best price to set the points at.
FAZ~FAS-1.7%15min.-Posting these just so I can compare and watch.
Yeah... there was a huge interest and then it died... Eh, oh well :)
JLS, looks like they are a little touchy on ETF board. Did you ever get anything finished on your RENKO project? Not much activity here. Ron
M
Green line will be tough. Signals thrown on circles.
Loose what money?
damn..you go thru a lot of trouble with all that crap to lose money...why don't you just burn it?
fast_eddie,
check out the following link.
http://wareseeker.com/free-renko/
There are a couple low cost Excel Renko and P&F add-ons that can be sampled.
I was doing my own version of Renko in Excel tonight, and found that link when I was doing a little search regarding rules for high/low-Renko charts. The rules seem to be pretty vague. Very few sites discuss anything but close-Renko charts. StockCharts has both.
fast_eddie,
help me understand what you want.
You say "Once I've seen the basic layout, I should be able to take it from there."
What is it that you want the "basic layout" for?
Would you define what a “basic layout” is?
Do you want the Excel code to create the data for a conventional Renko chart with nonlinear time scale and 45-degree brick trend lines? I have already indicated that the only Excel code that does that (that I know of at this time) is a Visual Basic module. You can find it at: http://tinyurl.com/5tu7tb .
Would you be happy enough with an unconventional Renko chart (with unconventional brick display and regular time intervals)? If so, I'll give you hints on how to do that (which I know will work), then you write the code yourself. The data will all be there, but it will not look like any Renko chart you ever saw, and if you apply indicators to the chart, the indicators will be based on time period instead of brick period (which I don’t see as a handicap because I wouldn’t put filter-based indicators on a Reno chart). I only suggest this because it would be the easiest way for you to write your own code -- I suspect it would be difficult for you to write code for a nonlinear time scale.
You said you have OHLC data for Excel. Is that only historical EOD data? Do you have historical OHLC intraday data (15-min, 30-min, 1-hr, etc.) for long periods of time (weeks, months)? If you want efficiency of trade, even if you are going to hold a position for days, you will need to trade intraday in the type of market we have now. To backtest such a system you will need to have on hand very long sequences of intraday data (preferably months). Unless you have a premium quote service, you will only be able to get a few days at a time of fine-grain historical data; and you will have to build up your long-term database by collecting and expanding your database every several days.
I doubt if you have long-term intraday historical data. Check out http://tinyurl.com/5w6onl for data sources. I suggest you get stocks and indexes. This site says you can get that data at GrainMarketResearch.com for $15 per month. Seems like a bargain, and you can use that data to do your backtests. You will be able to get current real-time data (with a history of a few days) from your broker, so you can use that for your real trades. Your broker probably does not do Renko charts. You can use QuoteTracker for that.
Renko is nothing more than a filter system, and it was originally developed for purposes of simplifying a stock chart display, minimizing price noise, and make it easier to visually identify trends. One could look at price and draw a Renko chart by hand, then add trend lines by hand. Current Renko users start with this old Renko style then apply indicators to the Renko chart. If that is all it is used for -- visual trend identification -- then I see no value in it, as all the information is already in price and modern computer programs can easily evaluate prices and apply indicators, and even draw trend lines, without the visual handicap that humans have. For my own system, which I will program up this winter, I will be implementing dynamic brick sizes -- every brick will be allowed different point sizes at any time based on both current and historical price conditions. In other words, my system will have a dynamic Renko filter, whereas the historic Renko chart is a static filter. This is like comparing the dynamic equalizers of modern communication modems to the very old modems which had, at best, fixed medium filtering. So it doesn’t help me much to use a standard Renko chart, therefore I haven’t been looking very hard for an Excel Renko chart.
JLS...I can write some pretty complex code in the excel cells. I've done a lot for back testing of various TA systems. Once I've seen the basic layout, I should be able to take it from there.
Thanks in advance...
FE
fast_eddie,
you're right. I don't know what you've been up to, but I got busy with Tech Support at QuoteTracker, helping them resolve some problems they have with their Renko charts. We've resolved some issues and have one minor problem left.
I presently know of only one canned way of generating Renko charts in Excel. The problem is it's a Visual Basic module, so you will have to be very proficient in that, which I gather you are not. I have a couple other downloads related to Renko and Excel but I haven't evaluated them yet.
Writing code to represent Renko bricks in native Excel is rather easy once you understand how Renko bricks are defined and when they stick or are erased.
Do you know how to write equations in Excel cells? Writing macros doesn't count. I've gotten the impression that you don't want to write the equations necessary to generate a Renko chart.
QuoteTracker has several schemes built in for exporting data, but I haven't determined yet what data can be exported. I'll get to that pretty soon.
Thanks I am in the same ballpark as yourself.
never have a problem getting filled - it's selling. hehe
If I like 2 stocks and one has lots of volume I always pick the stock that has the better money flow
pennies have pretty much dried up money flow wise lately but when they were running u can get some major money flow in them - some can trade like half million dollars a day, but now most only trade around 20 grand
What is the size of your trades? With some of these low vol stocks do you have a problem with fills?
simplegreen would probably be the best to ask
we all used to use points when we first started playing around with Renko charts, but it was too time consuming figuring out and adjusting for each chart each day that I decided to just use ATR 7 or 14.
I agree that the method u described is better and more accurate but to much of a bother for me
I love playing the pennies, especially subpennies - keeps a chartist on his toes. LOL
Lately no money in the pennies, so i've been playing the big board stocks that are now penny stocks such as VNBC, TARR, AGT, NG, etc
Mr. Bigz, now that I have your attention how do you determine brick size? I don't like to use the Renko ATR setting because it fluctuates. I've gone to set points at close. The value determined is 1/10 of the ATR 14 on a candlestick chart for the index, stock. Any thoughts based on your experience? Thanks.
Peter
I want to thank you, Charger, and Renkoron for your help. I used the systems demonstrated here and have applied them to Index trading. Using the index itself $rut, $mid etc, I trade mvv,mzz,tna,tza, uyg. I make money slowly but consistently and sometimes stumble onto HIG. Penny stocks are beyond my skill level and tolerance for adventure. Renko has allowed me to improve my trading. Thanks.
Peter
Hey Peter.
Man, HIG has had quite a run
u might wanna add the short term MACD and ADX indicators - notice what happens when they "pinch" together
JLS...we seemed to have gotten off track a bit. After some thinking about it, do you know how or can direct me somewhere if I provide in excel, open-hi-lo-close data, I can generate a renko chart. The rest of the TA I can take care of.
thanks again,
FE
My chart is a composite of all the information from this board including all of Charger, Mr.Bigz indicators. I'm attempting to see when the trades go against me why it happens- a trading diary.
http://stockcharts.com/h-sc/ui?s=MVV&p=15&yr=0&mn=0&dy=10&id=p52402898272
http://stockcharts.com/h-sc/ui?s=HIG&p=15&yr=0&mn=0&dy=10&id=p52402898272
Peter
Like yourself I trade ETFs and like to trade mechanically. I started with the Mechanical Board with Value Line ratings at Motley Fool drifted to Clearstation and followed Footquarters to IHUB. Support and resistance was my mainstay. I've used crossovers, CCI trading with Woodie etc.
Renko Charts are the perfect solution for me and I have tried to read as much as possible and have tried to benefit from my mistakes. I have used Renko for the last 2 months.
I trade 15 min charts using .5 point close blocks for stocks less than $50, 1 point close 15 minute for stocks whose price are > $50. I use TRIX 3,3 to confirm with 1/2 going in with the first block of the reversal and the last half with the second. I"ve tried to read all the posts of Charger and Mr. Bigz. I don't trade Penny stocks and only trade stocks which trade > 1000000 shares a day. I place market orders mostly and try not to trade within the first 15 minutes of the trading day. The stocks I trade are 2- HIG because of a familial tie to the company and MVV because of MVP-Steve Norris. My goal is to earn $2000 a week. With the 2x, 3x ETF being created it presents an excellent trading vehicle particularly with the high VIX. Renko is the perfect way to trade these ETFs. Price is the the best arbiteur and renko allows you to follow price as closely as possible. I'm asking questions because these trading conditions will change But for now a shorter time frame seems to be working well.
The HIG has been very profitable this year because of its wild swings. Whether it contiues is anyone's quess.
Peter
Pete, what kind of chart are you using? Can you post it? Ron
|
Followers
|
95
|
Posters
|
|
|
Posts (Today)
|
0
|
Posts (Total)
|
2124
|
|
Created
|
06/14/08
|
Type
|
Free
|
| Moderators simplegreen charger PremierStocks joanneg leftyg | |||

Welcome to the Renko Chart Form in which Renko charts are used to determine the following about a security:
(a) Easy identification of support and resistance lines.
(b) Easy identification of continuation patterns such as triangles.
(c) Identification of reversal patterns such as head and shoulders, triple tops, double bottoms and other classically accepted reversal patterns.
(d) Discovery of trends and their reversals that cannot be "seen" on a PPS chart.
(e) Refine our abilities to daytrade/swing a chart as to build up our accounts.
Basic Information on Renko Charts
Renko charts predate the traditional PPS chart and were developed at least four centuries ago. Grounded in the "Renga", the Japanese word for "brick", Renko charts present a representation of the PPS movement not unlike a swing or three line break chart. Unlike swing and three line break charts, the OHLC format is replaced by "bricks" which indicate the "trend" while filtering out small variations from the trend. In classical Renko charts, not subject to tricks mentioned later, a brick is drawn in the direction of the prior move if and only if the securities price moves with a particular strength/magnitude; with a strength/magnitude indicated by the brick size. Only when the price moves at least one brick size will the Renko chart add a brick -- even if it takes several days to generate such a movement! Thus, Renko charts ignore time and track ONLY the movement of the price regardless of how long it takes to register a change of sufficient magnitude/brick size.
The construction of the chart is simple -- If prices move more than the Brick size above the top (or below the bottom) of the last brick on the chart, a new brick is added in the next chart column. Hollow bricks are added if prices are rising. Black bricks are added if prices are falling. Only one type of brick can be added per time period. Bricks are always with their corners touching and no more than one brick may occupy each chart column. (Note: Some people use this coloring scheme, but others use customs colors.) It's important to note that prices may exceed the top (or bottom) of the current brick. Again, new bricks are only added when prices completely "fill" the brick. For example, for a 5-point chart, if prices rise from 98 to 102, the hollow brick that goes from 95 to 100 is added to the chart BUT the hollow brick that goes from 100 to 105 is NOT DRAWN. The Renko chart will give the impression that prices stopped at 100.
Reading a Renko Chart
The MOST important information on the Renko chart is when bricks change colors; indicating a trend change has *just* occurred. Just as in a swing chart, the change in brick color indicates a trend has established and appears stable enough to trade. (People who make swing charts using OHLC know this behavior.) Although this seems and easy way to determine trades, one must choose whether or not a one brick change is sufficient. Some people accept one brick as an entry point, but others require the confirmation of a second brick as to avoid whiplash, remorse, and traps.
Curiously, if you're into TA, all the same rules of TA apply. Look for patterns, resistance/support lines, head and shoulders, channels, double bottoms, triple tops, and other signals. All the rules you learned for PPS charts apply -- even PSAR/SAR signals. Word of warning, Fib-lines are still up for debate, but the forum will test them out and try to figure a modified method. The trick is translate the Renko findings to a PPS chart and develop a personal trading system. In general one can assume:
(a) The resistance/support in a Renko corresponds to a resistance/support in the PPS chart. The number of times such a resistance/support is tested indicates its strength on the PPS chart.
(b) Reversal and continuation patterns in the Renko chart are a lagging signal for trading the PPS chart.
(c) Channels on Renko charts reflect channels in the PPS chart; even if the PPS chart is too ugly as to see the channel. Sometimes the Renko will imply the B. Bands as a channel.
Keep in mind that classical Renko charts show the history of the PPS -- they are not predictive. Soapy Bubbles will present a method in which to introduce errors into the Renko chart as to make them predictive in Amibroker.
Parameters at Stockcharts.com's Renko Chart
There are two ways to specify the Brick Size for a Renko chart: Absolute Points and Average True Range (ATR). In addition, you can specify whether closing prices or high/low prices are used.
Absolute Points
With the "Absolute Points" method, you specify the size of each brick on the chart in points. The advantage of this method is that it is very easy to understand and predict when new bricks will appear. The disadvantage is that the point value needs to be different for high priced stocks than for low priced stocks. Typically you will need to choose a value that is roughly 1/20th the average price of the stock during the time frame you want to chart. Common values include 1, 2, 4, and 10. Another way to select a value is to choose the average volatility in the PPS and use that as the point. For example, if a stock tends to swing 0.03 per day, try that as the point size. Sometimes you'll get better resolution on trend changes.
Average True Range (ATR)
The "Average True Range (ATR)" method uses the value of the ATR indicator to determine the brick size. The ATR indicator is designed to ignore the normal volatility of a stock and thus it can "automatically" find good brick sizes regardless of the value or volatility of the stock selected. ATR with a value of 14 is the default value for Renko charts and should generate a very usable chart in most cases. If you want to find the ATR on your own, keep in mind that the ATR is the greatest of the following:
(a) The distance from today's high to today's low.
(b) The distance from yesterday's close to today's high.
(c) The distance from yesterday's low to today's low.
Just find the values and choose the largest one. That's your ATR. There are fancy ways to manipulate the ATR and that will be described later.
High/Low Prices
When using High/Low prices, it's important to note that the rules for drawing Renko charts favor hollow bricks. In other words, regardless of the current direction of the bricks, you first check to see if any new hollow bricks can be added to a chart and, if they can, you then stop without looking at the lows of the day.
If you're using High/Low and points for your chart (which you should), the ATR(14) from SC.com will help you.
Long and Short Charts
When choosing the timeframe for the Renko chart, keep in mind the Renko chart ignores time. Thus a long and short term charts will perform the same. In addition, five minute Renko charts may be utilized for daytrading.
Renko Methodologies and Abuses to Help Traders
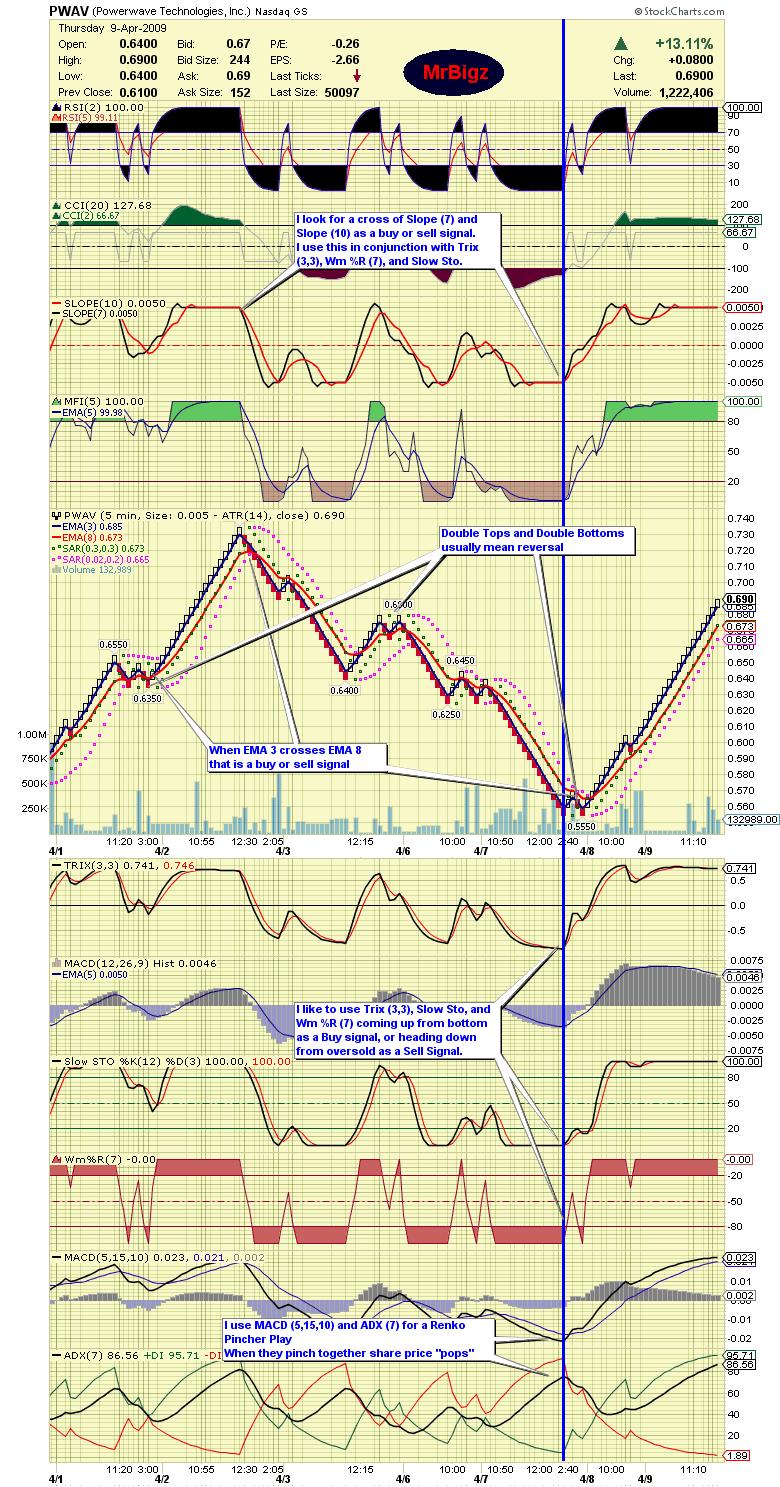
Mr. Bigz's (BI) Indicator Method

The BI indicator (a creation of Mr. Bigz) is a clever convolution of TRIX(3,3) and Renko Momentum displaying the triple exponentially smoothed moving average of a closing prices over a given time interval; whether it be daily or a matter of minutes. The elimination of whipsaws is established via EMA crossings and is explained in the above chart. As a system, the BI provides a complete trading system suitable for scanners and daytraders alike.
Soapy’s Predictive Error Method (PEM)
TBA
The One Block SWC System

Note: The sell signal should occur only if the STO is over 80 or 82. Anything below that isn't quite a real sell signal unless the stock is diluting or bad news becomes public.
The Two Block ADX System Requiring Confirmation

Note: It's nice to wait for confirmation, but sometimes you will miss out on some of the profit.
Soapy's CCI Method (Risky as Hell)

Note: I've burned myself with this method a few times and found it's a big board method. Nonetheless it does work on the OTCBB/PK for securities with healthy volume and a small short position. Also the CCI method may issue an early sell if the securtiy rides the upper B. Band for a long period of time. In that case, use the SWC method. Simplegreen notices that if you plot Slope(20) under the CCI(20)/CCI(2) signal, you can filter out false sell signals by sticking with the security when the Slope(20) is relatively high and stable (nearly horizontal line over 0). Even if the CCI(2) drops while the Slope(20) remains high, stay in. Once the CCI(2) and Slope(20) drop in unison, that's a truer sell signal. Another sell signal exists when %K crosses under %D on the Full STO since it seems to slightly lead the CCI sell signal.
DRAFT: Setting up the Standard Renko Chart (SRC)
The SRC has the following settings:
(a) One year timespan for daily charts. If you use a intraday chart, choose a timeframe that fills the chart nicely with data.
(b) Select ATR(14).
(c) The chart should have the CCI(20)/CCI(2) setup as discussed earlier in the iBOX.
(d) The chart should have the FULL STO for sell signals.
(e) Slope(20) or Slope(10) should be included as to filter out false sells on the CCI method.
(f) If it's a 1,5,10,15, or 60 min chart, include the RSI(2) for buy/sell signals.
(g) Some people like to use the Trix(3,3) and this is optional.
Educational Materials
EQUIS: Technical Analysis from A to Z
Author: Steven B. Achelis
RapidShare Link:
http://rapidshare.com/files/110945475/Technical_Analysis_From_A_To_Z__By_Steven_B_Achelis_.pdf.html
Stockcharts.com Reference on Renko
http://stockcharts.com/school/doku.php?id=chart_school:chart_analysis:renko
Other Websites For Information
http://www.investopedia.com/terms/r/renkochart.asp
http://www.marketscreen.com/help/atoz/default.asp?hideHF=&Num=94
http://www.markettide.com/html/renko.html
http://www.weboma.com/renko-chart-how-to-trade-using-renko-charts/
http://www.day-trading-strategy.com/Renko.html
http://www.stator-afm.com/renko.html
http://www.traders.com/Documentation/FEEDbk_docs/Archive/082007/Abstracts_new/Duddella/duddella.html
Here is a great video explaining the Renko system!!
http://breakpointtrades.com/CamtasiaFiles/Renkosystem/Renkosystem.html
|
Posts Today
|
0
|
|
Posts (Total)
|
2124
|
|
Posters
|
|
|
Moderators
|
| Volume | |
| Day Range: | |
| Bid Price | |
| Ask Price | |
| Last Trade Time: |


