 News
News  Market Data
  Discover
Support: 888-992-3836
Copyright © 2023 InvestorsHub Inc.


Register for free to join our community of investors and share your ideas. You will also get access to streaming quotes, interactive charts, trades, portfolio, live options flow and more tools.
SIA-Charts Daily Alert Service Pick for today =MKL : Very Bullish as of this morning : Besides having a superman show up, which happens when the stock goes 5% above its 100 day moving average. We also have a super cross show up which means that the 50 day moving average has broken above the 100 day moving average, which is also very bullish and means that buyers are coming in big time.

SIA-Chart for KBR : Very Bullish : Besides having a superman show up, which happens when the stock goes 5% above its 100 day moving average. We also have a super cross show up which means that the 50 day moving average has broken above the 100 day moving average, which is also very bullish and means that buyers are coming in big time. Remember Superman is bullish and skull and crossbones are bearish.

SIA-Charts Daily Alert Service Pick for today=CKH : Very Bullish as of this morning : Besides having a superman show up, which happens when the stock goes 5% above its 100 day moving average. We also have a super cross show up which means that the 50 day moving average has broken above the 100 day moving average, which is also very bullish and means that buyers are coming in big time.

SIA-Charts Daily Alert Service Pick for today =Hemp : Bullish : Besides having a superman show up, which happens when the stock goes 5% above its 100 day moving average. We also have a potential super cross coming down the road, which means that the 50 day moving average will move above the 100 day moving average, which is also very bullish and means that buyers are coming in big time. Remember Superman is bullish and skull and crossbones are bearish.

SIA-Chart on CCUR = Smooth Sailing

SIA-Chart for =SGI: Very Bullish :UP! UP! and AWAY!!! Besides having a superman show up, which happens when the stock goes 5% above its 100 day moving average. We also have a super cross show up which means that the 50 day moving average has broken above the 100 day moving average, which is also very bullish and means that buyers are coming in big time.

SIA-Charts issued an Alert on MWIP at .01 and we were right for a clean homerun. We offer 100,000 free charts plus daily alerts from 27 nations.

SIA-Chart for =PPHM: Very Bullish : Besides having a superman show up, which happens when the stock goes 5% above its 100 day moving average. We also have a super cross show up which means that the 50 day moving average has broken above the 100 day moving average, which is also very bullish and means that buyers are coming in big time. The same exact pattern happened last July as the chart clearly shows and that was a massive boom before the bust.

SIA-Chart for =WMIH: Very Bullish : Besides having a superman show up, which happens when the stock goes 5% above its 100 day moving average. We also have a super cross show up which means that the 50 day moving average has broken above the 100 day moving average, which is also very bullish and means that buyers are coming in big time.

Thanks $uperman,
The charts are showing great results as we recommended shorting Apple and going long NFLX at $70.
With the alert service up and running traders can get daily alerts from 27 countries on Stocks, Etf's etc..
Regards,
Mycroft
Nice Call!!!
SIA-Chart on MJNA = UP, UP, and AWAY!!!
Our charts recommended the stock back in August at .05 when Superman showed up.
SIA-Chart on MJNA = UP, UP, and AWAY!!!
Our charts recommended the stock back in August at .05 when Superman showed up.
We were right!!! We offer 100,000 free charts and daily alerts 

Sorry Mick,
I don't understand the question, can you explain what you mean?
Thanks,
Mycroft
so is poison point of btm entry? gww
SIA-Charts Daily Alert Service Pick for today = CKH : Very Bullish as of this morning : Besides having a superman show up, which happens when the stock goes 5% above its 100 day moving average. We also have a super cross show up which means that the 50 day moving average has broken above the 100 day moving average, which is also very bullish and means that buyers are coming in big time.

SIA-Charts Daily Alert Service officially went live today. After 6 months of work we finally got all the bells and whistles working and we launched this morning. Every night our computers will scan through 100,000 charts from 27 countries and then list those who achieve real time Superman and Skull and Crossbones results. For about a $1 a day subscribers will wake up every morning to a fresh new list to assist them in their trading. The SIA-charts main site is now free with no log in required.
Here is an example of what I will be posting everyday on IHUB:
SIA-Chart Daily Alert Service Pick for today = GWW : Bullish as of this morning : Besides having a superman show up, which happens when the stock goes 5% above its 100 day moving average. We also have a potential super cross coming down the road, which means that the 50 day moving average will move above the 100 day moving average, which is also very bullish and means that buyers are coming in big time. Remember Superman is bullish and skull and crossbones are bearish.

100% gain since Superman showed up
SIA-CHARTS B'marked. Nice job here! Would love to see a chart on SRGE. Ty..
100% gain since Superman showed up:

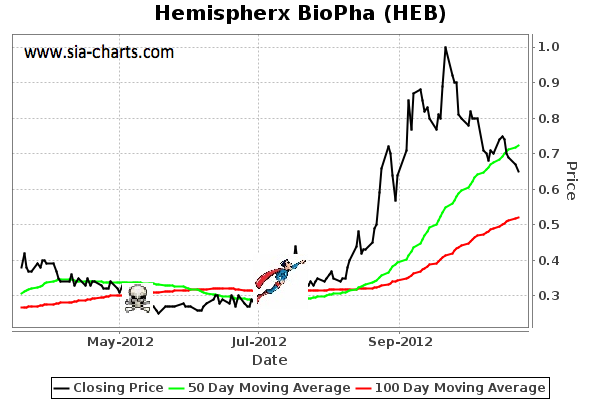
SIA-Chart on HEB : Still positive but the 8% trailing stop would have triggered on it a while back. If it breaks the 100 day moving average you might have a problem. But could retest the 50 day and if it does then it could shoot up again. A ton of profit taking after such a huge run up.
SIA-Chart for JRCC : Very Bullish : Besides having a superman show up, which happens when the stock goes 5% above its 100 day moving average. We also have a super cross show up which means that the 50 day moving average has broken above the 100 day moving average, which is also very bullish and means that buyers are coming in big time.

SIA-Chart for COST : Very Bullish and one of my largest holdings: Besides having a superman show up, which happens when the stock goes 5% above its 100 day moving average. We also have a super cross show up which means that the 50 day moving average has broken above the 100 day moving average, which is also very bullish and means that buyers are coming in big time.
.png)
SIA-Chart for EMXX : Very Bullish : Besides having a superman show up, which happens when the stock goes 5% above its 100 day moving average. We also have a super cross show up which means that the 50 day moving average has broken above the 100 day moving average, which is also very bullish and means that buyers are coming in big time.

Just 10-11-12. Will go look at WOF. Thanks.
http://ih.advfn.com/p.php?pid=squote&symbol=WOF
SIA-Chart : Very Bullish : Besides having a superman show up, which happens when the stock goes 5% above its 100 day moving average. We also have a super cross show up which means that the 50 day moving average has broken above the 100 day moving average, which is also very bullish and means that buyers are coming in big time.

SIA-Chart for BLRX : Bullish : Besides having a superman show up, which happens when the stock goes 5% above its 100 day moving average. We also have a super cross very close to showing up, which means that the 50 day moving average will break above the 100 day moving average, which is also very bullish and means that buyers will be coming in big time.

SIA-Chart for MRCY : Very Bearish : Besides having the skull and crossbones show up, which happens when the stock goes 5% below its 100 day moving average. We also have a death cross show up which means that the 50 day moving average has broken below the 100 day moving average, which is also very bearish and means that sellers are coming in big time.

SIA-Chart on CNMD: Very Bullish : Besides having a superman show up, which happens when the stock goes 5% above its 100 day moving average. We also have a super cross show up which means that the 50 day moving average has broken above the 100 day moving average, which is also very bullish and means that buyers are coming in big time.

SIA-Chart on WPI : Very Bullish and on cruise control up since April : Besides having a superman show up, which happens when the stock goes 5% above its 100 day moving average. We also have a super cross show up which means that the 50 day moving average has broken above the 100 day moving average, which is also very bullish and means that buyers are coming in big time.

The Power of SIA-Charts

originally posted on September 5, 2012
http://investorshub.advfn.com/boards/read_msg.aspx?message_id=79244931
SIA-Chart on HOLX : Very Bullish : Besides having a superman show up, which happens when the stock goes 5% above its 100 day moving average. We also have a super cross show up which means that the 50 day moving average has broken above the 100 day moving average, which is also very bullish and means that buyers are coming in big time.

SIA-Chart on AMCF : Very Bearish since April : Besides having the skull and crossbones show up, which happens when the stock goes 5% below its 100 day moving average. We also had a death cross show up which means that the 50 day moving average has broken below the 100 day moving average, which is also very bearish and means that sellers are coming in big time.

SIA-Chart on EXPR: Very Bearish since May: Besides having the skull and crossbones show up, which happens when the stock goes 5% below its 100 day moving average. We also had a death cross show up which means that the 50 day moving average has broken below the 100 day moving average, which is also very bearish and means that sellers are coming in big time.

SIA-Chart on WST : Very Bullish and on cruise control : Besides having a superman show up, which happens when the stock goes 5% above its 100 day moving average. We also have a super cross show last year up which means that the 50 day moving average has consistently stayed above the 100 day moving average, which is also very bullish and means that buyers are coming in big time.

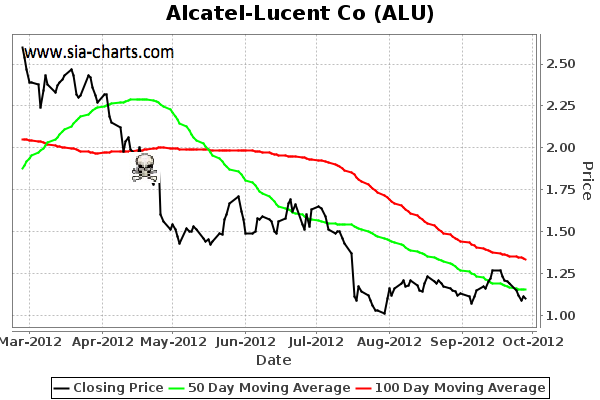
SIA-Chart on ALU : Very Bearish : Besides having the skull and crossbones show up, which happens when the stock goes 5% below its 100 day moving average. We also have a death cross show up which means that the 50 day moving average has broken below the 100 day moving average, which is also very bearish and means that sellers are coming in big time.
SIA-Charts for the Golden Girls  All three very bullish.


SIA-Chart for TWO : Very Bullish and on cruise control upward. The stock had its Superman/Supercross show up back in 2011 and has been a very solid performer due to its high dividend payout.

SIA-Chart on KNDI : Very Bullish : Besides having a superman show up, which happens when the stock goes 5% above its 100 day moving average. We also have a super cross show up which means that the 50 day moving average has broken above the 100 day moving average, which is also very bullish and means that buyers are coming in big time.

SIA-Chart on OCZ : Very Bearish : Besides having the skull and crossbones show up, which happens when the stock goes 5% below its 100 day moving average. We will also have a death cross show up after my chart updates tonight, which means that the 50 day moving average will break below the 100 day moving average, which is also very bearish and means that sellers are coming in big time. So the skulls are out in full force on this one and the shorters are partying, as it seems like a serious falling knife developing and anyone trying to catch it most surely will get bloodied.

SIA-Chart Alert on WOF.V : Super Cross should be arriving soon as the stock is up 3.31% today: Besides having a superman show up, which happens when the stock goes 5% above its 100 day moving average. We also have a super cross very close to showing up, which means that the 50 day moving average will break above the 100 day moving average, which is also very bullish and means that buyers will be coming in big time.

SIA-Chart for CRY: Makes anyone invested in it cry with Joy!

Awesome SIA-Chart for RMD: Really on cruise control up!up! and away!

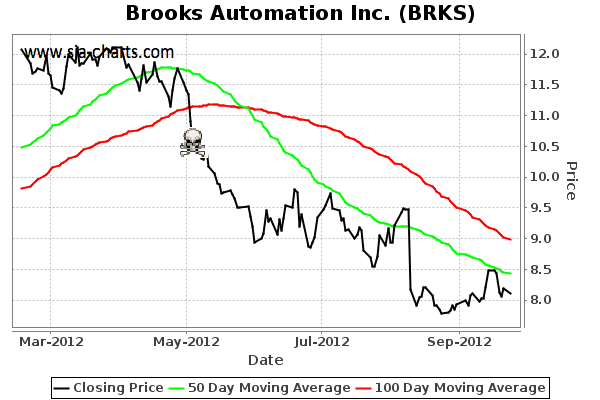
SIA-Chart for BRKS : Very Bearish : Besides having the skull and crossbones show up, which happens when the stock goes 5% below its 100 day moving average. We also have a death cross show up which means that the 50 day moving average has broken below the 100 day moving average, which is also very bearish and means that sellers are coming in big time. Looks like a classic falling knife looking for someplace to land with no luck as of yet.
NVDQ SIA-Chart looks like it is on cruise control upward:

|
Followers
|
18
|
Posters
|
|
|
Posts (Today)
|
0
|
Posts (Total)
|
159
|
|
Created
|
08/26/12
|
Type
|
Free
|
| Moderators | |||

How to Use SIA-Charts
By Mycroft
www.sia-charts.com
Director of Investment Research
With high-speed computer systems ruling the roost on trading floors all over the world, we believe that the average, individual trader is at a disadvantage in trying to compete with the major investment firms. So the secret to success is not to compete with the "big guns," but to observe what they do and then react. Accordingly, we have created a technical analysis tool to measure top-level investor sentiment called SIA-Charts (Statistical Indicator Analysis).
SIA-Charts shows you key entry points on when to buy, when to hold, when to sell, and importantly, when to add to a stock position that you already own. Our system also helps growth investors from selling too soon (Stepping in Front of a Moving Train) and value investors from buying too early (Trying to Catch a Falling Knife).
We have published an article on "Seeking Alpha" which explains the basic concepts of the system. ( http://seekingalpha.com/article/546181-moving-trains-falling-knives-death-and-super-crosses )
The following summarizes how one may trade successfully using SIA-Charts.
SUPER CROSS
When a stock price moves 5% or more above its 100 day moving average, this signifies that a possible "Super Cross" may be coming and the "flying man" symbol: ![]() is shown on the chart. This is a signal for a potential purchase. If and when the 50 day moving average crosses over the 100 day moving average, a "Super Cross" will be triggered ~ this is a sign that more good times may be coming. If you decide to make a purchase at this point, then you should also initiate a trailing stop that is 8% below your purchase price, and then ride the stock up until your trailing stop loss is triggered. So the purchase gets automated and you maximize your gains by minimizing your losses, by getting out at 8% below at your trailing stop.
is shown on the chart. This is a signal for a potential purchase. If and when the 50 day moving average crosses over the 100 day moving average, a "Super Cross" will be triggered ~ this is a sign that more good times may be coming. If you decide to make a purchase at this point, then you should also initiate a trailing stop that is 8% below your purchase price, and then ride the stock up until your trailing stop loss is triggered. So the purchase gets automated and you maximize your gains by minimizing your losses, by getting out at 8% below at your trailing stop.
DEATH CROSS
If, on the other hand, the stock price drops to 5% below its 100 day moving average, then the system will show the skull-and-crossbones symbol: ![]() to signify that a potential "Death Cross" may be coming. This is where the 50 day moving average drops below the 100 day moving average, and it may be a good time to short. Again, once you go short you should also initiate a similar trailing stop loss of 8% above the purchase price, this time, to cover your short and then automate the process.
to signify that a potential "Death Cross" may be coming. This is where the 50 day moving average drops below the 100 day moving average, and it may be a good time to short. Again, once you go short you should also initiate a similar trailing stop loss of 8% above the purchase price, this time, to cover your short and then automate the process.
We are mapping the purchases and sales of the large institutional investors, who usually move very quickly. If you decide to trade using SIA-Charts, then you must make sure to use your trailing stops. We recommend this because one good or bad news event (such as the unexpected death of a CEO or a good/bad earnings report) on a particular company can cause a complete reversal, where you would get caught on the wrong side of a trade. By having your trailing stops in place, you minimize potential negative impacts to your trades. Also bear in mind that the higher the "Beta" is for a given stock, the greater the volatility and the shorter the window of opportunity. For example a high tech stock may have a shorter trading window than that of a major drug firm. So always watch the "Beta" and adjust your time horizon accordingly.
SIA-Charts works on stocks, ETF's, Mutual Funds and essentially anything you can trade where a chart can be generated. Our charts display stocks from multiple markets and countries, so do a symbol look-up and see if you can generate a chart from a stock market of your choice in a country of your choice. Always remember to diversify heavily in any kind of trading to spread your risk around and always use trailing stops of 8%. If you want to take on more risk, then you can push the envelope and use 10% trailing stops instead of 8%, but remember that bulls and bears make money, but pigs get slaughtered.
We will constantly be adding new features to the site, so please visit often as our charts will be updated after every market close and usually updates will be shown prior to the next day's market open. So visit often, because much can happen in one day and though your trailing stops on your trades are automated, it is always good to watch the action as often as possible, so you know where you stand on a daily basis.
In conclusion, SIA-Charts is a free service and under no conditions do we provide investment advice. This service is geared more toward traders, but can be used successfully by growth and value investors by potentially preventing growth investors from selling too soon or value investors from buying too early. We believe that we are able to map the footprints of the major investment firms. In doing so, we provide an opportunity to help level the playing field. By offering SIA-Charts free-of-charge, we hope to help as many as possible not only to make money but also to protect themselves from potential losses. So if you like what you see please click on our advertiser's banners from time to time and help fund our growth in providing more services to you in the future. If you want to make sure this service remains free, please tell your friends and family about us, as word-of-mouth is the best form of advertising.
Best of Luck in your trading and we hope you find SIA-Charts useful.
Mycroft
| Volume | |
| Day Range: | |
| Bid Price | |
| Ask Price | |
| Last Trade Time: |


