 News
News  Market Data
  Discover
Support: 888-992-3836
Copyright © 2023 InvestorsHub Inc.


Register for free to join our community of investors and share your ideas. You will also get access to streaming quotes, interactive charts, trades, portfolio, live options flow and more tools.
Anybody for a beer? $SAM is smoking today!
Still around HH. Just using other venues.
Miss you guys. Wishing you all the best!
Hey dotnet,
Maybe you should go to his board and leave a message to post some setups to follow. I'm sure he checks it out once in a while.
we miss kraigger and his macd set ups.
Good to see that!
You may not how much vision you've given me.
I'll pay it back....in due course. Of course.
Goody, Saw your post on the OM board. How you doing?
Nice to see you're still trading options once in a while.
good luck to you on he NKE thing.
hey there kraigger. was' sup ?
i've been staying busy myself with my various interests from trading to writing to bonsai.
trading wise it's been quite intriguing with the algo's and HFT's to go up against. either my trades are in n' out within the same day or 1 day hold,...
or i buy 1 and sometimes 2 months out. safety and allows for the move i see to develop. i set a tight stop loss in case i took the wrong direction. got to save that capital.
a of mine friend who trades futures says,..."You can always put on another trade, but not if you don't have a brokerage account !" this is a man who has $1.1M in his brokerage account,...so i'll be listening to him 8^)
Pivots are the key to me. how this market reacts and responds to Pivots are nothing short of amazing and at the same time i know why they are reacting. it's all in cycles and patterns. the algo's create it,...the key is recognizing the fingerprint.
for me it's always been about Volume and Price.
charts are a great tool but they are still lagging indicators. Volume and Price are in the present moment and can be monitored as the markets move.
charts have their limitations which has been even more comprised by algo's and HFT's ,...suxs for traders,..especially options.
but,...Pivot Points really, really assist where price potentially is going.
Pivot Points have been the magic bullet for price direction.
I'm finding out that the best way to insure a profitable trade is to check the put call ratio and the order flow. Charts have become a bit unreliable
to trade off of completely. Too many charts look good only to find that the masses are trading the other direction and can leave you with a rapid loss.
Also now with using Volume Profile I catching stocks at price lows and ride major moves up/down rather than day trading and hanging onto the monitor all day. Over night and three day trades are giving me the best results.
Takes a bit of doing to develop a system of Pivots and Volume Profile but the results and great.
fwiw,...Rothschild Just Dumped Massive Amounts of US Assets, Sending an Ominous Signal
By Jay Syrmopoulos
August 30, 2017
In an ominous move, Lord Jacob Rothschild has aggressively moved to limit his exposure to "risky" U.S. capital markets.
article with detailed content and graphs here;
http://thefreethoughtproject.com/rothschild-aggressively-moves-assets-out-us/
Stock Margin Debt Signal Reaches 5 Alarm Level
Daniel R Moore
Aug. 30, 2017
Summary
-At the end of July 2017, NYSE margin debt was at an all-time record high of $549.9B.
-Prior to the most recent major market corrections, NYSE margin debt peaked at 2.63% of GDP in mid-2007 and 2.78% in the year 2000.
-The ratio of NYSE margin debt to GDP now stands at 2.86%.
-This article reviews why the odds are high that record relative margin debt levels are signaling that the stock market has reached a cyclical peak.
https://seekingalpha.com/article/4103012-stock-margin-debt-signal-reaches-5-alarm-level
well the forum has just taken a hiatus 8^) sometimes it's best to stay away from as much noise as possible to have clear decision making. i know that is what i've been doing.
"Then there's order flow, put call ratio, short ratio, one of my favorites Volume Profile. The Also's see everything and act accordingly. Always against the trader.Takes more than charts and indicators to trade this market successfully."
yepper,...volume and price to me are key ! no matter that the Algo's and HFT's are in control of 90%+ of the market flow, price and volume still tell the tale.
other indicators assist quite a bit in discerning direction of price and to discern that the other magic bullet are Pivot Points. probably one of the best discoveries i've found to comprehend price moves.
for me the main thing to keep in mind is that its the Algo's , HFT's and institutions that move things. the retail buying is important but only when institutions are not moving the price. but with a particular pattern the trader can see / observe institutional buying or selling thus creating the direction for price to move.
lately my trading has been either short term one day holds or long term (1 -2 months out) options with tight stop loss for protection of capital. there's always another trade so i exit when i'm wrong in price direction.
OMG! the board has a breath of life in it.
"it has no real relevance any longer with algo's and HFT's taking over 90% of the trading."
Then there's order flow, put call ratio, short ratio, one of my favorites Volume Profile. The Also's see everything and act accordingly. Always against the trader.Takes more than charts and indicators to trade this market successfully.
Nlightn
Good to hear Buddy, we should talk sometime on the phone. I changed to an Apple Phone and 90% of all my contacts did not transfer. I won't buy a private account here, not worth it yet so 15 post a day. Plus with Text these days its easier sometimes to trade with a select few.
I would love to chat, call me or send me your number to my email kraigger23@yahoo.com so we can chat
Talk about the volume set up you have now; as I have always had Pivots and Yes I trade on the Pivots Resistance and Support
Good to here from you, Bout time I make it back to Florida and meet this time
Craig
hey there kraigger. we are all still around just not much on iHub.
still trading just not as much in this whacky manipulated market. i just got out of a SPY put that i held for one day,...in at .75 out at 1.32,...nice $weet profit.
i have minimized my chart set up to select indicators. pivot points, volume, Accum/Dist, RSI,...EMA 5,15,...that is it for me.
i heavily rely on Pivot Points and Volume,...those are key to me. MACD is a secondary indicator of which i don't place a lot weight on it any longer and i use more as a confirmation tool the other indicators. it has no real relevance any longer with algo's and HFT's taking over 90% of the trading.
i like an indicator as close to real time market action,.... Pivot Points and Volume are in real time. it's amazing how price tags PP levels all throughout the day,..and the trade appears.
anyways,...hope all is well.
Vish, I also called the Bounce Back.... HAHAHAHAHAHA
I have been out of practice for sometime and it was important to put the company back together first after the Divorce. I am hoping to trade more often starting next week.
around 2.30 I will post if I have an overnight but my expectations are sideways tomorrow
Kraigger23,
Really awesome call on the dump today. And nice call on SPX calls. Glad your are back.
Thanks.
Where did everybody GOOOOOOOOOO
And the tumble begins. Nice trade on TSLA yesterday and now I'm in puts for today and Friday. Whole market seems ready for a correction.
Hopefully shorts get their way rest of week. What a drop in $SPX.
A quiet play.
TSLA -$3 premarket (TOS)
If you are talking Bradley, it's a very strong indicator with an 85-90% accuracy rate.
Worked your IWM theme today. Thanks for the trade idea.
Filled Buy to Open 6 IWM Jun 02 2017 135.5
Call Limit 0.53 09:58:58 05/31/17
Filled Sell to Close 4 IWM Jun 02 2017 135.5
Call Limit 0.83 11:06:34 05/31/17
Held 2 runners from 1st trade FnC
Filled Buy to Open 6 IWM Jun 02 2017 135.5
Call Limit 0.67 11:18:52 05/31/17
Filled Sell to Close 8 IWM Jun 02 2017 135.5
Call Limit 0.81 11:24:53 05/31/17
Filled Buy to Open 6 IWM Jun 02 2017 136.0
Call Limit 0.47 11:29:43 05/31/17
Filled Sell to Close 6 IWM Jun 02 2017 136.0
Call Limit 0.67 13:16:09 05/31/17
been playing with a 5ema, 15ema and fib pivot points for entry and exits.
played a MSFT MayWk4 $69 call,...underlying price at the time of option trade was $67.45.
the pattern is every time price drops to the 15ema it bounces back up to the 5ema and rides up the 5ema until price hits the top of the 5ema and within a period of time,...ex;
April 19 price hit $64.47 and hit the 15ema,...then literally the next day, April 20 until May 10 it rode the 5ema until it hit a price of $68.92 and moved back down to the 15ema for a few days then back up to ride the 5ema again.
i'm still looking at volume and how it is driving the price and how it can be viewed to see the pattern about to begin.
working with IWM also:
Filled Buy to Open 10 ISHARES PUT May 138
Limit 0.27 12:45:33 05/10/17
Filled Sell to Close 6 ISHARES PUT May 138
Limit 0.86 -- 09:57:16 05/11/17
Filled Sell to Close 2 ISHARES PUT May 138
Limit 0.86 -- 09:57:16 05/11/17
Filled Sell to Close 2 ISHARES PUT May 138
Limit 0.86 -- 09:57:16 05/11/17
ALGN and I are having fun together again.
Filled Buy to Open 5 ALGN May 19 2017 140.0 Call Limit 0.42 -- --10:44:54 05/10/17
Filled Buy to Open 5 ALGN May 19 2017 140.0 Call Limit 0.45 -- --10:56:46 05/10/17
Filled Buy to Open 2 ALGN May 19 2017 140.0 Call Limit 0.42 -- --11:14:08 05/10/17
Filled Buy to Open 1 ALGN May 19 2017 140.0 Call Limit 0.42 -- --11:14:08 05/10/17
Filled Buy to Open 2 ALGN May 19 2017 140.0 Call Limit 0.42 -- --11:14:08 05/10/17
Filled Sell to Close 3 ALGN May 19 2017 140.0 Call Limit 1.00 -- --10:01:41 05/15/17
Filled Sell to Close 4 ALGN May 19 2017 140.0 Call Limit 1.00 -- --10:01:41 05/15/17
Filled Sell to Close 6 ALGN May 19 2017 140.0 Call Limit 1.10 -- --10:08:43 05/15/17
Filled Sell to Close 2 ALGN May 19 2017 140.0 Call Limit 1.10 -- -- 10:08:44 05/15/17
Lloyd, The trade that I escaped on. This was right after you TWEETED squeeze on SNAP. Got in too early.
The buy:
Filled Buy to Open 5 SNAP May 12 2017 19.0 Call
Limit 0.32 -- 11:06:58 05/11/17
Filled Buy to Open 5 SNAP May 12 2017 19.0 Call
Limit 0.08 12:44:20 05/11/17
Filled Buy to Open 5 SNAP May 12 2017 19.0 Call
Limit 0.10 -- 13:08:59 05/11/17
The sell:
Filled Sell to Close 15 SNAP May 12 2017 19.0 Call
Limit 0.25 -- 14:40:20 05/12/17
This went to $0.5/0.40 after I got out.
Master Card is working the PP's I'm working MA
Filled Buy to Open 3 MA May 05 2017 119.0 Put Limit 0.84 -- -- 10:36:10 05/02/17
Filled Sell to Close 3 MA May 05 2017 119.0 Put Limit 1.30 -- -- 15:55:18 05/02/17
Dumb Money keeps the market moving higher..
Dumb Money Bulls Vs. Smart Money Bears
John Galt0 Comments
April 7, 2017
In this article, I will discuss how the dumb money is driving the stock market higher. When reviewing the behavior of dumb money investors, human psychology comes into play. The reason psychology is more important in describing the behavior of dumb money investors than smart money investors is because professional investors are aware of the logical fallacies which can harm performance. This isn’t to say professional investors don’t make mistakes, but at least they’re making a concerted effort to avoid common pitfalls. The other advantage professional investors have is that they do real research based on data. We know dumb money investors are not doing research because they bought stocks at the height of the dot com boom and are repeating the same mistakes now.
The most basic, but most powerful factor in reviewing why the dumb money is so bullish is recency bias combined with herd mentality. The thinking is that everyone is buying index funds and index funds have done well in the past few years so it must be a good decision to get in on. Recency bias effects herds because the herd gets to proclaim how great it’s doing and bash anyone who was skeptical of the rally. When I bring up any factors about the economy or valuations to members of the herd, they get confused. They don’t understand how there could be any bearish factors if stocks are doing well. That justification for being bullish because stocks are up is the very reason why stocks ignore fundamentals.
The chart below shows the historical dumb money weekly investment into the Dow Jones Industrial Average. As you can see, the dumb money is the most bullish it has ever been in this cycle. There was a significant dip in speculation in 2015, but the market was able to hold steady because of zero percent interest rates and cycle peak buybacks in Q4 2015. The jump in dumb money speculation and short covering after the election gave this rally the support it needed as the Fed started to raise rates at a quicker pace.
The chart below is almost identical to the chart above because the dumb money is putting its money into passive investments. At the end of bullish cycles, the strategy of buy and hold increases in popularity because investors believe most stocks always move higher over time. Making the argument against passive investing is tough because most mutual funds can’t beat their benchmark when you account for the fees they charge. A few years ago, I was one of the proponents of using ETFs instead of mutual funds. Even with this great performance when everyone piles into any asset, it does poorly after the bandwagon becomes too filled up. It’s tough for me to say whether active management will beat passive management in the coming downturn because mutual funds own many of the stock in the index. Luckily it doesn’t matter because my goal isn’t to lose slightly less money than the index; the goal is to preserve almost all my capital.
On the other side of the ledger, the smart money commercial hedgers are the most bearish they’ve ever been. While it’s tough for me to tell how well most mutual funds will do in a bear market, the professional investors who are hedging are the ones who will be the least scathed by the correction. The historical precedent of bandwagon trends reversing makes me think active investing will take market share from passive investing after the crash. The investors who are burned by the market fall may look at the few investment vehicles which outperformed and realize they are mostly active funds. One supporting example of this reversal of a bandwagon effect is how home equity loans still haven’t come near their peak in the mid-2000s before the bubble burst. Investors may make the same types of mistakes, namely taking too much risk by overpaying for an asset, but they won’t make the mistake in the same vehicle.
You may be asking why the smart money is more bearish than the dumb money. There are many reasons for this. One reason can be seen in the chart below. The negative revisions to S&P 500 earnings have taken a chunk out of actual earnings. The trend bottomed in 4Q 2015, but the negativity has continued.
Revisions don’t matter to bullish speculators because they are already focusing on future earnings estimates which are optimistic. One of the rules of the earnings game is that future earnings are always bright. The estimates are dropped right before earnings season so firms can beat them when they report. The problem is the earnings beats miss the original expectations. The bull market stalled when earnings started to decline in 2014 and 2015. It’s tough to glaze over an earnings recession. This time there is a different chink in the earnings machine. Future expectations have gotten out of hand as you can see in the chart below. Great earnings growth is supposed to make up for a hawkish Fed, but its doubtful profit margins will be able to reach a new record high with a tight labor market.
Obviously, I can’t fit every reason active managers may be bearish on stocks into half an article, but I think the most critical one is shown in the chart below. The chart shows the relative positioning central banks have taken historically. When central banks are loose, the ‘risk on’ trade is in play as liquidity is high. QE1, 2, and 3 provided some liquidity, but now it’s waning as the Fed hikes rates and unwinds the balance sheet. I have doubted the Fed’s hawkish policy in the past, but I remain consistent on the perspective that after monetary policy tightens, there will be a crisis.
Conclusion
The dumb money differs from the smart money. Dumb money investors are plowing money into passive ETFs because of past performance. Smart money investors who are hedging are doing so because the central banks are about to lower the liquidity in the markets and because profit margins don’t increase when the labor market is tight.
4
Thank you Jeff York and StockGod....
Combining Points, RSI and volume Profile paid off today.
Got in way too early at first.
Filled Buy to Open 2 AMZN Apr 07 2017 907.5 Put Limit 4.55 -- 09:30:03 04/05/17
Strapped on my nuggies and doubled down.
Filled Buy to Open 2 AMZN Apr 07 2017 907.5 Put Limit 1.87 -- -- 11:49:00 04/05/17
Avg. $3.21
Later:
Filled Sell to Close 2 AMZN Apr 07 2017 907.5 Put Market 5.55 -- -- 15:34:24 04/05/17
Filled Sell to Close 2 AMZN Apr 07 2017 907.5 Put Market 5.15 -- -- 15:35:39 04/05/17
A better one..
Filled Buy to Open 3 BABA Apr 13 2017 109.0 Put Limit 1.68 -- -- 10:30:53 04/05/17
Filled Sell to Close 3 BABA Apr 13 2017 109.0 Put Limit 2.14 -- -- 15:28:03 04/05/17
Over night hold on Gold..
Filled Buy to Open 5 GLD Apr 13 2017 119.5 Put Limit 0.84 -- -- 09:30:35 04/04/17
Filled Sell to Close 5 GLD Apr 13 2017 119.5 Put Limit 1.24 -- 09:31:32 04/05/17
this current market is total BS. what is the logic / market intelligence that an indice moves 250+ points to 20965 on Mar 21 and the following day Mar 22 it tanks to 20590,...then on Mar 23 price moves back up to 20760 ,...then finishes the week with a 20599,..complete BS.
the invisible hand of the Fed and Government Sachs and other stock market manipulating entities has screwed matters up sooooo tragically that all the pooch can do is tuck his tail and go into protection mode.
“We’re coming from a point of view that we’re in this kind of final wave of this bull market, and the market is transitioning from a ‘buy the dip’ to kind of a ‘sell the rip’ environment”.~ Northman Trader
None of this is technically outlandish, yet participants no longer consider corrections of size viable speaking again to the extreme optimism permeating markets. Well, I’m no longer calling for a correction, I’m outlining the elements of a major bear market emerging over the next couple of years.
And if you are looking for capable political leadership to implement practical solutions that help avoid a recession, the events of the past week should give anyone reason to pause whether you are a supporter of the administration or not. My view remains: We are facing huge structural issues in the economy and neither political party has proven itself to be willing and/or capable to address them. Indeed, they may not be fixable without a massive re-alignment first.
One final thought: Next week not only the month, but also the quarter ends and price closes at that time will be of interest to technicians as potential rejection candles are worth watching.
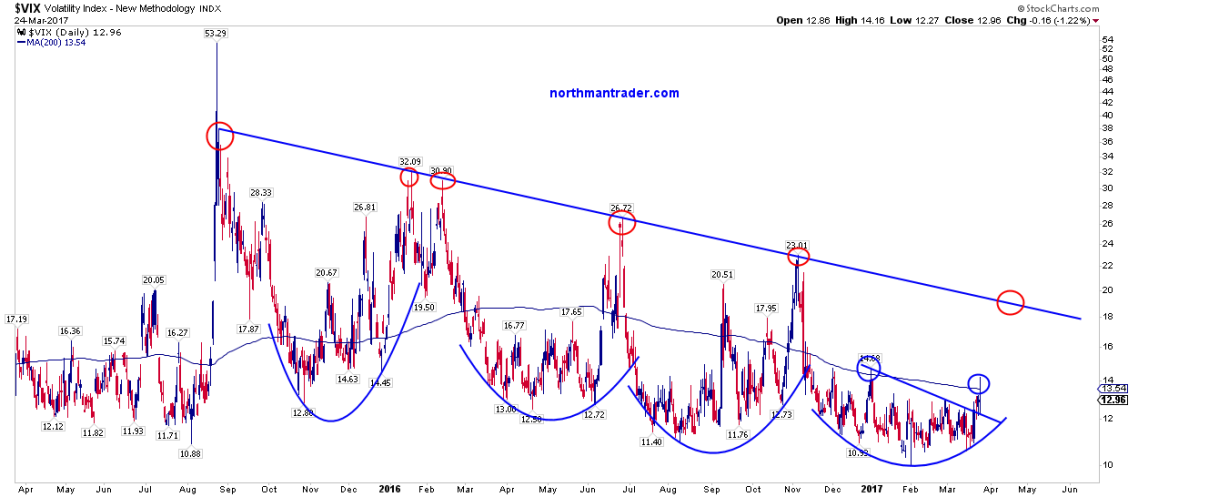
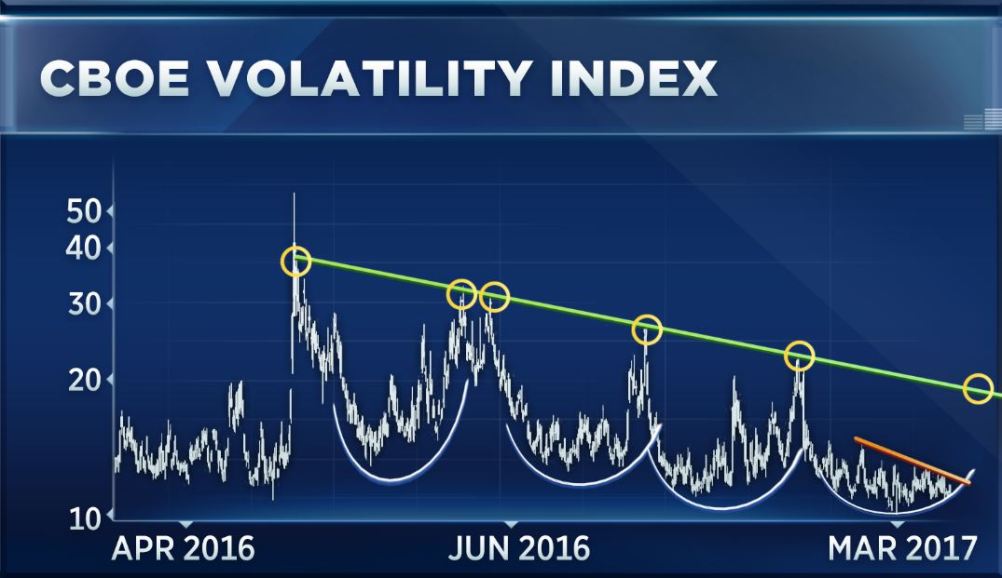

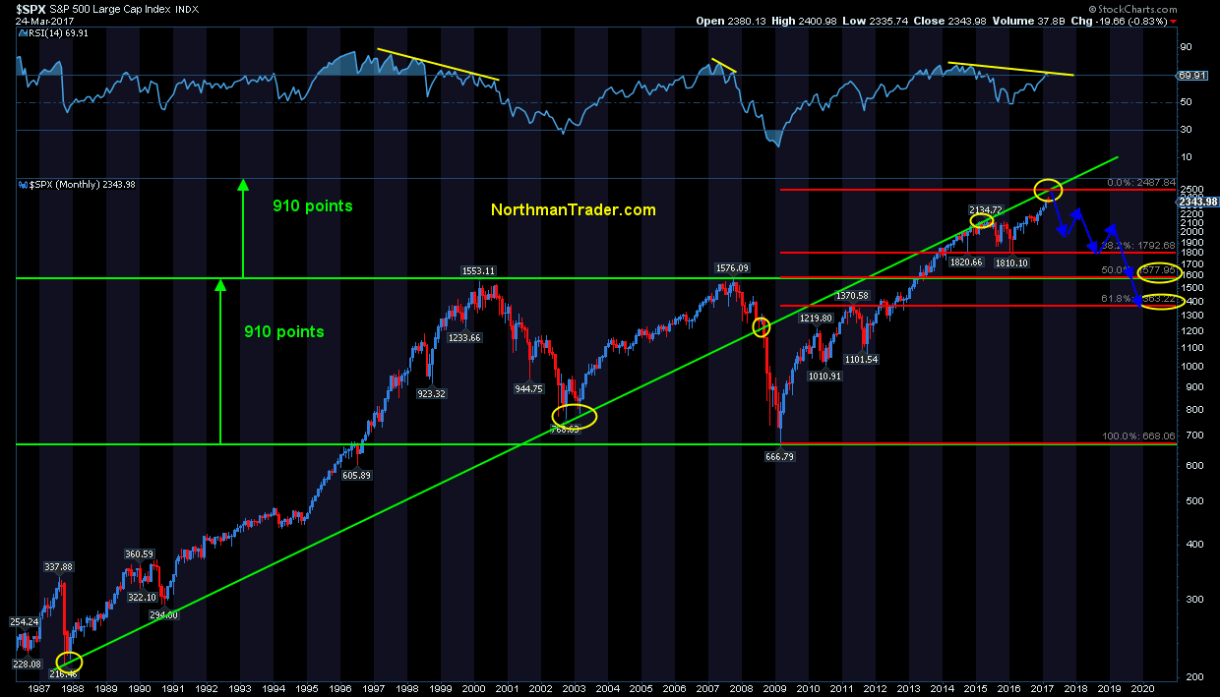
Source:
https://northmantrader.com/2017/03/25/the-final-wave/
AAPL chart. Using this a longer term play comes into view.
http://tos.mx/TQxL6X
I'm finding that RSI is a very good long and short range indicator of over sold/bought conditions. Mid term is a little tricky. I'm using many different time frames now trying to see which works best on which stocks. I'm limiting my list to ones I've scalped because of being familiar with their patterns already.
I noticed when scalping that there were times when I missed longer term moves due to taking the short money.
The 70-20 thing should be looked at also. A lot of stocks will trade in a 60-40 pattern as their over sold over bought range. When they move to the 70/20 range they become a better trade.
I saw some people on TWTR using this to trade low priced stocks with great success. So I am trying it out on larger capped stock and their options. Over all I think you could trade less and make more.
http://tos.mx/KCPOO9
vegas what's this "It(RSI) is a different kind of PP". u mean rsi. what settings u use on 5 mins.
Hey dotnet thanks for the post. Sorry for the delay long day.
Right now I'm trading the morning hours in scalping trades. After TDA dropped my commission rate I find I can scalp 3-5 contracts for quick trades. Not the greatest trading plan but a safe one. I've been combining PP's with RSI for entry point and exit points.
It(RSI) is a different kind of PP.IMO
Only problem is finding a stock with cheap options that will pop good for the scalp. And The big secret I found is realizing what is a good percentage money scalp and taking it.
I can usually find three or four stocks that will pop or fall enough to give me a quick 35-40% in minuets. Taking that profit has eluded me at times when greed hits and I stay for more. Bad idea. Take the $$$ and run. I'm talking 4 to 10 min. and you hit.
I have a lot on my plate right now. So this type of trading lets me keep my hand in things and I still can make my commitments.
thats a huge dump. how are you guys doing pivot traders. today is the bradley's turn date but looks like market will turn after few days of the turn date.
News hitting the wire...Hugh AAPL dump
http://tos.mx/Eg4FhF
http://www.zerohedge.com/news/2017-03-17/someone-just-dumped-13-billion-worth-aapl-shares
good fortune to you on PANW !
I'm playing calls on the B/O RUMOR. Small position. They are really messing with this thing today. I have 3/17 $118 calls. And $135's for next week. I might have to go out further. But only 2/3 contracts only.
PANW,...what side are you playing ?,..calls or puts ?
Fasten your seatbelts. Trays in the upright position.
http://tos.mx/KKEjGH
PANW unconfirmed Buyout rumored..... LOTTO. but some really nice strikes left.
I'm in $118 and $135 calls for two different expiration dates.
http://cnafinance.com/palo-alto-networks-panw-stock-spiking-on-ibm-takeover-rumor/14129
Recent chatter drove stock price on Friday.
Trade at your own risk. Do your own DD.
Sorry for the super late reply. Got it handled and thank you.
|
Followers
|
11
|
Posters
|
|
|
Posts (Today)
|
0
|
Posts (Total)
|
1677
|
|
Created
|
05/27/16
|
Type
|
Free
|
| Moderators | |||


| Volume | |
| Day Range: | |
| Bid Price | |
| Ask Price | |
| Last Trade Time: |


