 News
News  Market Data
  Discover
Support: 888-992-3836
Copyright © 2023 InvestorsHub Inc.


Register for free to join our community of investors and share your ideas. You will also get access to streaming quotes, interactive charts, trades, portfolio, live options flow and more tools.
COT - Commitments of Traders in Metals Futures Market Reports
By: Software North | July 1, 2022
Gold

Silver

Read Full Story »»»
 DiscoverGold
If u trade, today may be good for profit. It should revisit 1800 before deciding where next.
GDX is dropping into a 40 week cycle low that is due next week
By: CyclesFan | July 1, 2022
• $GDX is dropping into a 40 week cycle low that is due next week. Since it broke below 27.50 yesterday it may drop to as low as 26. Following that low it's likely to bounce into August before dropping into the next 80 week cycle low and 7 year cycle low that is due in April 2023.

Read Full Story »»»
DiscoverGold
Gold Stocks’ New Short-Term Lows Can Only Mean One Thing
By: Przemyslaw Radomski | July 1, 2022
• If not for the war, there would’ve probably been a repeat of the 2008 gold market. However, there is something similar: the bearish outlook for miners.
Gold stocks are declining similarly to how they did in 2008.
History Can Be Rhymed

The Russian invasion triggered a rally, which was already more than erased, and if it wasn’t for it, the self-similarity would be very clear (note the head-and-shoulders patterns marked with green). Since the latter happened, it’s not as clear, but it seems that it’s still present. At least that’s what the pace of the current decline suggests.
I used a red dashed line to represent the 2008 decline, and I copied it to the current situation. They are very similar. We even saw a corrective upswing from more or less the 200-week moving average (red line), just like what happened in 2008.
We saw a breakdown to new short-term lows, which means that the volatile part of the slide is likely already underway.
Today’s decline in silver prices to new yearly lows definitely supports the above.
All right, let’s zoom in and see how mining stocks declined in 2008.

Back then, the GDXJ ETF was not yet trading, so I’m using the GDX ETF as a short-term proxy here.
The decline took about 3 months, and it erased about 70% of the miners’ value. The biggest part of the decline happened in the final month, though.
However, the really interesting thing about that decline – that might also be very useful this time – is that there were five very short-term declines that took the GDX about 30% lower.
I marked those declines with red rectangles. After that, a corrective upswing started. During those corrective upswings, the GDX rallied by 14.8-41.6%. The biggest corrective upswing (where GDX rallied by 41.6%) was triggered by a huge rally in gold, and since I don’t expect to see anything similar this year, it could be the case that this correction size is an outlier. Not paying attention to the outlier, we get corrections of between 14.8% and 25.1%.
The interesting thing was that each corrective upswing was shorter (faster) than the preceding one.
The first one took 12 trading days. The second one took seven trading days. The third one took 2 trading days, and the fourth and final one took just 1 trading day.
Fast forward to the current situation. Let’s take a look at the GDXJ ETF.

The GDXJ ETF declined by 32.4% and then corrected – it rallied by about 20.3%. The corrective upswing took 14 trading days.
The above is in perfect tune with the previous patterns seen in the GDX during the 2008 slide.
What does it tell us? It indicates that history can be rhymed, and while it will not be identical, we should pay attention to the indicators that worked in 2008. The next corrective upswing (a notable one, that is) might start when the GDXJ ETF declines by about 29-35% from its recent top. To clarify, I don’t claim that the above technique would be able to detect all corrective upswings, or that I aim to trade all of them. For instance, in my view, it was a good idea to enter a long position on May 12 and switch to a short position on May 26, but I wasn’t aiming to catch the intraday moves.
GDXJ could also decline a bit more than 29-35%, as let’s keep in mind that previous statistics are based on the GDX ETF and we are discussing the GDXJ here, and the latter is likely to decline even more than GDX as juniors are more correlated with the general stock market (and the latter is likely to slide).
So, let’s say that the GDXJ might decline between 29% and 40% from the recent high before triggering another notable corrective upswing (one that could take between 5 and 10 trading days based on how long the last one took and how big those corrections were in 2008).
The recent high was formed with the GDXJ ETF at $42.19. Applying the above-mentioned percentages to this price provides us with $24.78-29.32. And yes, the above would be likely to take place along with a big decline in gold prices.
Now, is there any meaningful support level in this area that could stop the decline?
Yes!

Still Bearish
The late-March 2020 low is at $26.62, and it provides significant short-term support within the analogy-based target area.
Additionally, the above corresponds – more or less – to the size of the decline that would match the size of the April-May decline. It would be only somewhat bigger.
Let’s keep in mind that gold stocks don’t necessarily move on their own, but rather move along with gold. So, if gold moves to its strong medium-term support provided by the 2021 lows and then starts a brief rally, the same action would be likely in mining stocks.
The head and shoulders pattern confirms that the downside target is well below $30, perhaps even as low as ~$24.
There’s also an additional detail present on GDXJ’s very short-term chart.

The GDXJ just broke below the declining wedge. While falling wedges are usually a bullish sign, they only become such after a break to the upside. What we witnessed was a relatively uncommon occurrence: a breakdown on the downside. The implications are therefore bearish instead of being bullish, and the profit potential for the current short position remains enormous.
Read Full Story »»»
DiscoverGold
Gold Stocks Enter the Contrarian Dream Zone
By: David Erfle | July 1, 2022
The gold complex came under more pressure this week on the reiteration by the US, UK, and European central banks that they are willing to do whatever it takes to combat inflation at the Annual ECB Forum on Wednesday. This was followed by more selling into quarter-end on Thursday, despite U.S. 10-year Treasury yields moving below 3%.
During the European Central Bank live-streamed event from Portugal, Fed Chair Jerome Powell said the central bank was running against the clock to beat inflation. Fed policy makers have no choice but to keep raising interest rates to achieve this, although there is no guarantee that it can provide a soft landing for the economy, Powell said.
“Is there a risk we would go too far [with rate hikes]?” Powell stated. “Certainly, there’s a risk. The bigger mistake to make, let’s put it that way, would be to fail to restore price stability.” The U.S. has experienced continuously higher inflation for more than a year, and it would be "bad risk management" to just assume that those longer-term inflation expectations "will remain anchored indefinitely in the face of persistent high inflation," Powell added.
Getting inflation back to the Fed's 2% target will involve "some pain," the increasingly frustrated Fed chair reiterated, but noted that "the worst pain would be from failing to address this high inflation and allowing it to become persistent."
Overall, recession talk has grown as U.S. data continues to disappoint and commodity pricing responds to deliberate Fed-induced demand destruction. And as the world’s largest central bank continues to make adjustments to its "unconditional" fight for price stability, recession risks are getting more visible in the daily macro data.
According to the Federal Reserve Bank of Atlanta's GDPNow model released mid-week, the U.S. economy is expected to contract by 1% in the second quarter, alarmingly down from the June 27th forecast of +0.3%. With the Commerce Department on Wednesday showing that U.S. GDP contracted by 1.6% for the first quarter versus the 6.9% growth in the fourth quarter of last year, the combined data puts the U.S. economy currently in recession with back-to-back negative quarterly GDP.
Moreover, the sharp decline in U.S. 10-year Treasury bond yields this week is threatening to cause the yield curve between ten-year and two-year bond yields to invert. A drop of the shorter yield over the longer yield is another sign of recession.
Up next on the U.S. inflation data docket the following day was the Fed’s preferred measure of inflation. The Personal Consumption Expenditures (PCE) price index was released on Thursday morning. According to the Commerce Department, core personal consumption expenditures spiked 4.7% YoY. Although this marks a 0.2 percentage point decline from April, the levels remain at a high not seen since the early 1980s. Headline inflation naturally rose higher after rising 6.3% YoY and 0.6% from the month prior.
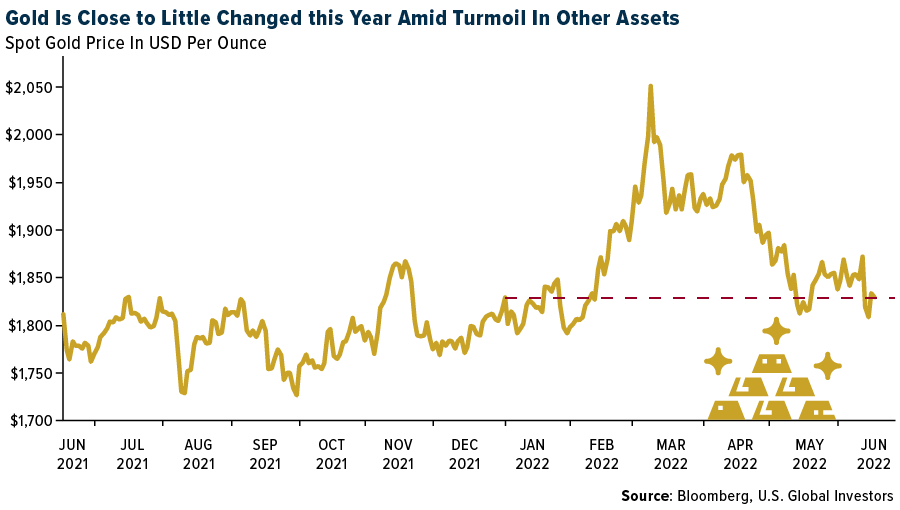
The initial reaction to the PCE data influenced the gold price higher towards $1825 as it was perceived that this report would decrease the size of the next rate hike in late-July. But the optimism was short-lived, as the bears gained control to print a $20 reversal in the gold price on the last day of Q2 Comex trade to close at $1807.
The recent decline in yields supports gold but at the same time, risk aversion is pushing commodity prices to the downside and the U.S. dollar higher. Although Gold Futures managed to end Q2 above the key $1800 level, the safe-haven metal printed its worst quarter in five as the U.S. dollar hovered near a recent two-decade peak and posted its best quarter in over seven years.
Meanwhile, both the mining complex and silver continue to show relative weakness to the gold price and closed at fresh two-year monthly lows on Thursday. Going into the 3-day U.S. holiday weekend, the silver price is in danger of losing the psychologically significant $20 level.
Furthermore, miner capitulation selling has been relentless since a false breakout in the complex took place in mid-April, reaching a “Contrarian Dream Zone” as we head into the second half of 2022. With investors throwing in the risk asset towel as the Fed barrels down a dangerous road towards an imminent policy error, the extreme oversold miner sector is likely coming close to a significant bottom.
On Thursday, the GDXJ briskly sold down to $32, which is the 50% retracement level from its August 2020 peak at $64 and was last seen when gold was being offered at $1375 per ounce three years ago. The junior miner ETF also closed the farthest below its monthly Bollinger Band support line since its inception in 2009. When combined with trading at the weekly Relative Strength Index (RSI) near 30, these are technical indications of the junior miner sector closing in on a near-term upside reversal.
Read Full Story »»»
DiscoverGold
Market for gold is full speed ahead, the price of gold just hit the floor and has a new ceiling to break through. Gold market has become extremely sophisticated and manipulated. It’s in the era of unlimited dollars. It ain’t going up unless it let go.
GDX has reached the ideal target for an intermediate term low
By: CyclesFan | June 30, 2022
• $GDX has reached the ideal target for an intermediate term low, the 0.618 retracement level of its March -August 2020 bull market at 27.49.

Read Full Story »»»
DiscoverGold
Spot gold looking clean and shiny today. Currently at 1823 with low bouncing off 1803 support. It could dip below 1815 but I see strength going on.
Spot closed at 1816.70. I was off by that much.
Gold will end day at about 1815. Right where the bots want it.
The Ord Oracle: GDX Update
By: Tim Ord | June 29, 2022
SPX Monitoring Purposes: Long SPX on 5/31/22 at 4151.09.
Monitoring Purposes GOLD: Long GDX on 10/9/20 at 40.78.
Long Term SPX Monitor Purposes: Neutral.
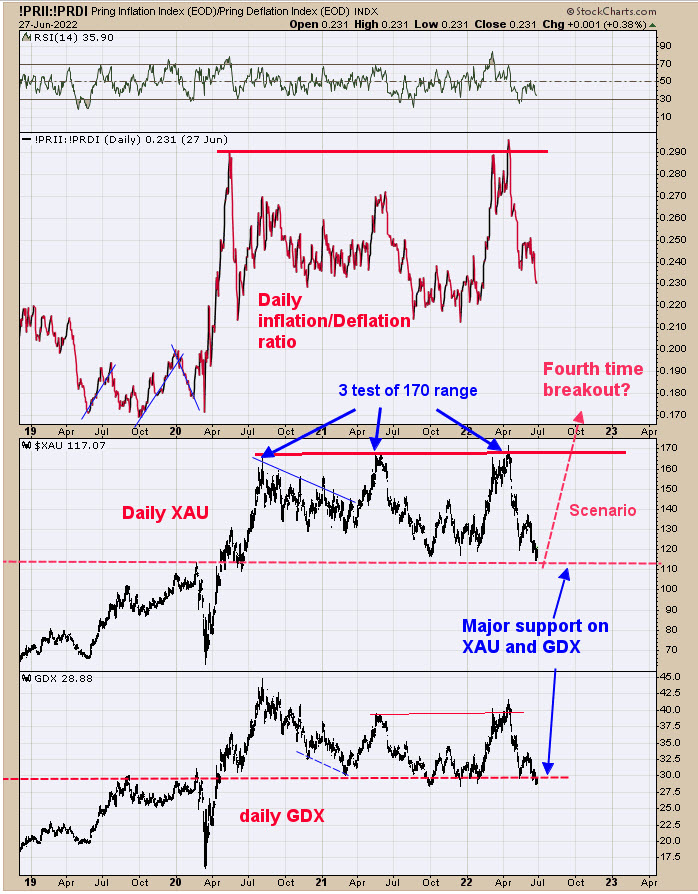
Yesterday and last Thursday, we said, "A rare signal generated on GDX. The last time this type of signal was generated was last October low. The signal is the RSI for the Bullish Percent index for the Gold Miners index. When the RSI for the Bullish Percent index falls below 5 (current reading is 4.40) the market was at an intermediate term low." This bullish signal lines up at major support for both GDX and XAU (note on chart above). Both XAU and GDX have been in a sideways trading range since August 2020. Its likely the current buy signal will work out and both XAU and GDX will rally back to their resistance, which is 170 on the XAU and the 40 range on GDX. For the XAU, the next time it gets up to resistance near 170 will be the fourth time. The more times an area is tested, the more likely the breakout will occur, so it likely the breakout will come on the fourth test. This sideways trading range for both XAU and GDX has been going on for nearly two years, and a two-year trading range suggests the next rise could last two years.
Tim Ord,
Editor
Read Full Story »»»
DiscoverGold
Gold Markets Continue to Give Up Their Early Gains
By: Christopher Lewis | June 29, 2022
• Gold markets have tried to rally on Wednesday but continue to give up early gains. This continues to be a “fade the rallies” type of market.
Gold Market Technical Analysis
Gold markets have been very noisy during the trading session on Wednesday as we continue to see a lot of back and forth. Quite frankly, gold will continue to struggle as long as the Federal Reserve monetary policy continues to get tighter, and of course interest rates in America rise in the bond market. The $1800 level underneath will be crucial, so I am paying close attention to whether or not we were to break down below there. After that, we have the uptrend line that could be crucial as well. If we break down below there, then the market really good start to fall apart.
Alternatively, if we break above the top of the candlestick for the trading session on Wednesday, then I think it is only a matter of time before the sellers come back in. We are near the bottom of an overall consolidation area, but it is worth noting that the most recent attempt to reach the top of that consolidation area did not get to the top again. Because of this, it looks like there is much more selling pressure than anything else, so I do believe that a rally that shows signs of exhaustion will probably get jumped on.
Ultimately, if the market were to break above the $1880 level, then it’s possible that we could go as high as the $2000 level, which is where we had started the negativity previously. Ultimately, this is a market that I think will continue to be very difficult, so I would keep my position size relatively small. Furthermore, you need to keep an eye on the 10-year yields in America.
Read Full Story »»»
DiscoverGold
Only gold can screw up an opportunity to run. Expect gold to visit below 1820 again. What a mess down there. Contract laying everywhere. BTC ain’t looking so good either, it was one of the very few left that technically made sense. We must be on top of a correction.
Yes miners will go down today because gold jumped the gun, may be one of the better days to pick up miners, or sell on this jump with lousy base then buy back in.
Won’t make it. Looks like 1820 is resistance. Fed bots romping it down even with majority gold buys. Powel and his associates are trying to destroy a 7 trillion dollar industry to cover their abuse of the dollar, u know that almost worthless fiat that Russia and China and India with replace as global standard. Almost exact pattern as yesterday
She be trying again.
Gold wants to go up, and solid buying. But bots not done with it at 1822?
POG will test 1765 within a month or so....the entire market and the miners will follow down down down and down more....this is early.
Strong move to 1829, let’s hope I’m wrong about retrace and it marches Forward.
Spot made a run from 1816 to 1828. Lots of volume but looks messy. Needs to go back and clean up contracts from 1818. Can’t build a pyramid without satisfying every level of support.
In the case of GDX, what effect will it have. Lots of buying here but still following gold trends.
I always enjoy reading your Perspective. Thank you
Gold still looking punch drunk, it can’t even get one real swing in at moving up. Sad very sad looking. It’s not consolidating its regurgitating. Looks down today.
Yup, gold at 1827, even better if shorted today. Central bot drove a mail right through the forward motion.
Back down below 1835 and matrix signals staring again. If u traded the wave good for u.
PMI is the latest greatest signal for gold, yet it’s still getting tamped back down with small sells. Will it overcome?
another late day $40m buy into this ETF
3rd test coming, or it just wants spot to be at 1836. Dollar recovering as well.
Bounced off 1835.87 2 times, once free flow once bot controlled. It’s so fixed it’s sickening but it is what it is. Maybe it’s now support, or it’s attempting to bust down through it.
Bots and Fed traders in complet control again. Earlier they got stomped, now they rule. Bank on it.
Fed ignited gold volume up and down. Don’t know which side of his mouth he is talking but futures markets trying to figure it out.
Barrick Gold, Kinross Gold, Yamana Gold seeing larger #darkpool activity after-hours
By: Money Flow Mel | June 21, 2022
• Metal names seeing larger #darkpool activity after-hours
$GOLD $KGC $AUY

Read Full Story »»»
DiscoverGold
Newmont Corporation (NEM) SIZE ~ 2.71 million shares at $65.26 #darkpool activity ~ 44% of 30D Avg Vol
By: Money Flow Mel | June 21, 2022
• $NEM SIZE #darkpool activity ~ 2.71 million shares at $65.26 ~ 44% of 30D Avg Vol.

Read Full Story »»»
DiscoverGold
Gold SWOT: Kinross Gold Has Completed the Sale Of Its Russian Assets
By: Frank Holmes | June 21, 2022
Strengths
• The best performing precious metal for the week was silver, but still down 1.45%. Tom Palmer, CEO of Newmont Mining, the biggest gold producer, sees a higher floor forming under the gold market as years of stimulus devolve into a fight to contain inflation. Gold has held up much better than cryptocurrencies as the broader markets have pulled back. This week we saw several major crypto firms freeze customer withdrawals.
• Resources closed a private placement with Newmont Ventures, a wholly-owned subsidiary of Newmont Corporation. Awalé projects are in Côte d’Ivoire and Glen Parson is the CEO. Odienné is the main project and the agreement is staged such that Newmont could earn up to 75% of the project.
• Streaming transactions totaled $1.7 billion in 2021, the strongest year since 2015. The sector has booked $487 million year-to-date compared to $455 million by this time last year. Wheaton Precious Metals has again been the most active with $366 million in streams, followed by Osisko Gold Royalties with $110 million.
Weaknesses
• The worst performing precious metal for the week was palladium, down 6.06%. Sibanye-Stillwater said it has suspended operations at its Montana-based palladium and platinum mines after the area was hit by flooding that washed away access roads and bridges. The Johannesburg-based precious metals producer was forced to evacuate some workers from the Stillwater and East Boulder mines and will wait for the waters to subside before conducting an assessment, spokesman James Wellsted said by phone.
• Gold futures continue to consolidate in a bearish pattern as the precious metal is caught between a broad risk-off and strong dollar flow. There may be an eventual resumption of the medium-term downtrend if the market continues to trade below $1,889-$1,899 and $1,917-$1,927 resistance layers. Broader range support remains near $1,700.
• Cost inflation continues to be a key theme for precious metals producers, and against that backdrop, the royalty names as a group outperformed in 2021, (down 4% on average versus the producers down 13% and gold 4%). So far in 2022, the royalty sector is down 2% on average against a flat gold price (up 1%), and while slightly lagging the senior producers they are outperforming the intermediate and junior gold producers, down 12% and 19%, respectively.
Opportunities
• Gold held much of its biggest gain in more than three months, reports Bloomberg, as shifting expectations of the speed of the Federal Reserve tightening helps the yellow metal rediscover its role as the ultimate haven asset. The resilience of bullion as the Fed announced its biggest interest-rate increase since 1994 is reminding investors of gold’s appeal, the article continues.
• Gold Fields has agreed to acquire Canada’s Yamana Gold for around $7 billion, reports Bloomberg. The deal provides greater geographic diversification but material EPS dilution. Under the terms of the agreed offer, 100% of Yamana outstanding shares will be purchased at a ratio of 0.6 of an ordinary Gold Fields share, valuing Yamana at $6.7 billion. The transaction is expected to close in the second half of the year. Yamana’s board has agreed to back the deal, which will require approval from both sets of shareholders.
• Orla Mining will acquire all of the issued and outstanding shares of Gold Standard by way of a court-approved plan of arrangement. Gold Standard's key asset is the 100%-owned South Railroad Project, a feasibility-stage, open-pit, heap leach project located on the prolific Carlin trend in Nevada. In February 2022, Gold Standard completed a robust feasibility study and permitting activities are currently underway. Gold Standard also owns the Lewis Project, a large, strategically located, prospective land package on the Battle Mountain trend in Nevada.
Threats
• Firmer inflation is historically bullish for gold prices. Now, however, it is being quickly counteracted by more aggressive pricing for a policy response from the Federal Reserve and other central banks. As such, there needs to be more signs that economic growth is cracking under the strain of higher inflation and tighter financial conditions, which would, in turn, support sustained safe-haven inflows into the precious metals sector.
• Dacian Gold announced it was suspending operations at Mt. Morgan, and open pit operations at Jupiter are to be suspended at the end of June. Over the past six months, Dacian noted it has seen a rapid change in the environment with significant inflationary cost pressures. Dacian will process existing stockpiles of ore and focus on
• exploration drilling below the Jupiter Pit.
• Renowned billionaire hedge fund manager Stanley Druckenmiller says that in an inflationary bull market, he wants to own Bitcoin more than gold “for sure.” However, he explained that in a bear market, he would prefer to own the yellow metal.
Read Full Story »»»
DiscoverGold
for today, gold getting ready to move, but which way. its sitting on support so hope its not broken. July and August, best months of the year for gold, and India and China buying up all of its production, Russia has an affinity for the shiny metal, so it should stay true to trending.
Gold finale for 2022 should be between 1930 and 2100. That is if it continues current trend. Fundamentally it’s worth 33k.
Newmont CEO sees new floor level for the gold price
By: Kitco | June 20, 2022
• Tom Palmer, the CEO of the world's largest gold miner Newmont, says the events of the last few years mean the floor for gold prices has lifted. There is also the fact that inflation means it could be more costly to get the yellow metal out of the ground.
Where they may have once fallen to US$1200/oz, Palmer thinks they will remain above US$1500-1600/oz, prices at which the major producers with the scale to keep costs low should be making bank despite rising supply chain and labor costs.
"I see no reason why you wouldn't, over the next year or two, see it around current levels, but more importantly sitting on top of a floor that has fundamentally moved given the events of the last couple of years," he said after delivering a keynote speech at the PDAC Convention in Toronto.
He added that small gold miners are struggling with rising supply chain and labor costs, consolidation in the sector makes sense.
Gold has been consolidating since late 2020 and there seems to be a consolidation low of $1678.1/oz and a high of $2075.14/oz. It appears that anything higher than $1500/oz pleases the Newmont CEO. The old 2011-12 consolidation now seems like a sticky zone and looks like it's providing some real support.

Read Full Story »»»
DiscoverGold
Gold/Gold Miners Fundamental Checkup
By: Gary Tanashian | June 20, 2022
As they leverage the macro, what’s good for gold is even better for gold miners
After last week’s article, in which we noted a unique move on ‘CPI Friday’ as gold and the miners put in an expected test of the lows and quickly reversed upward, unique among a world full of bearish markets…
A pivotal juncture for gold and gold stocks
…let’s take a checkup on and important fundamental consideration in the wake of FOMC and the .75% rate hike that everyone knew was coming.
But first I want to remind readers that this (NFTRH & NFTRH.com) is not a place to visit if you want to get pumped on oil, copper and general (and cyclical) commodities and resources along with gold. It is the place to visit if you want discrete commodity analysis amid cyclical/inflationary conditions and/or a guide to the proper macro fundamentals that should be in place for gold and gold stocks in their rare but unique utility as a counter-cyclical market, unlike commodities and stock markets.
We’ll cover one key item (others will be consistently updated in NFTRH, as will ongoing technical analysis of individual quality gold/silver stocks), which is gold’s relation to other more cyclical and inflation sensitive markets.
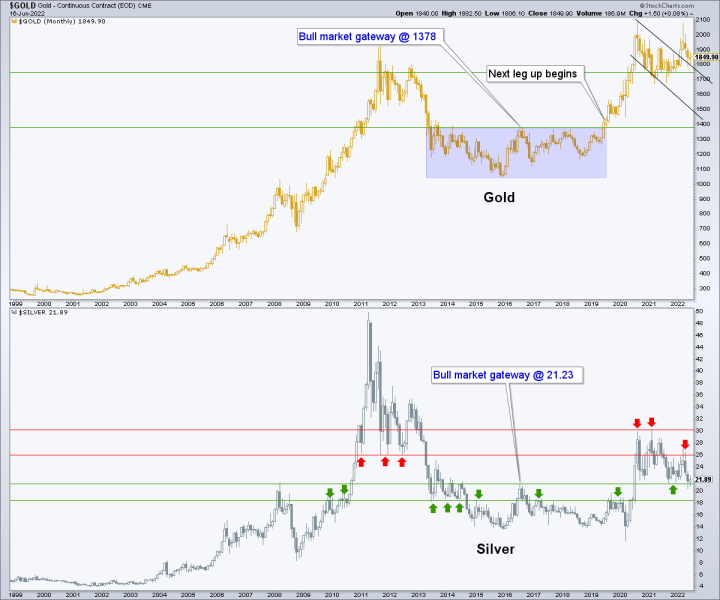
But first a look at the monthly charts of gold and silver, showing intact status. The gold price has moved from the bull gateway breakout in 2019 to a new high, to a handle that represented the correction the precious metals needed as we noted in mid-2020. Then came the handle breakout and this year, the retest of that breakout (still in progress). Gold’s big picture remains bullish.
Silver is sloppier but as noted on June 14 it has key support at 21.25 and 18.25. It currently holds support #1. Also per that post, silver has to clear the 22 area resistance (not defined on this monthly chart), which we’ve been tracking in NFTRH since early May. Silver, while a lesser precious metal, is obviously a tale wind to the bull case for the whole complex if it also rallies.
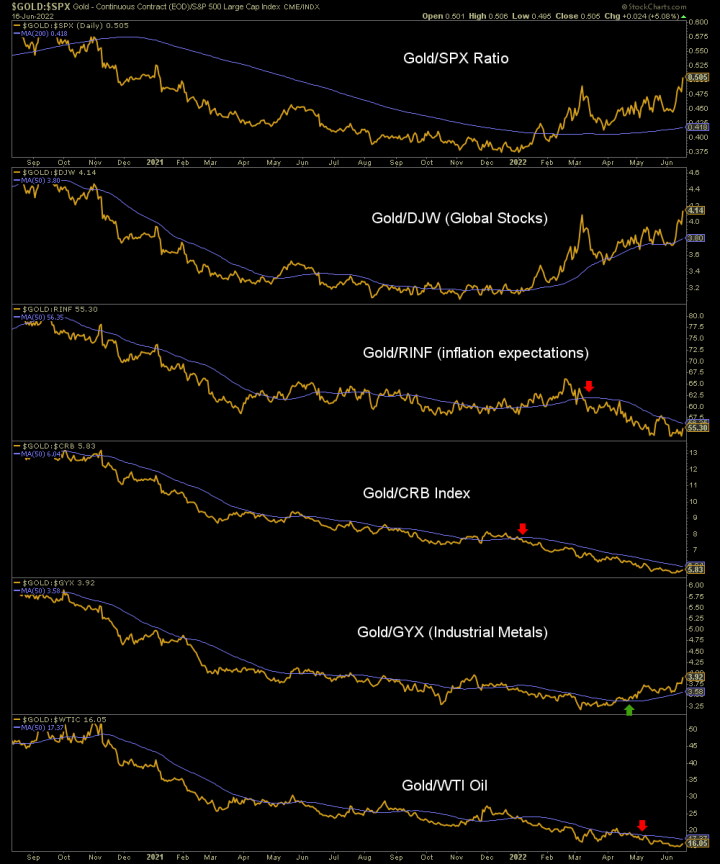
It is important for gold stocks to leverage the macro in a positive way. Since mid-2020 the miners have leveraged an inflationary macro in a negative way (contrary to what your local gold stock promoter has touted). This macro snapshot shows Gold/Stocks having turned up, taken a hard test and resumed upward. Counter-cycle, here we come. The counter-cyclical view is aided by Gold/Industrial Metals, including Doctor Copper. It looks like gold has made a good bottom vs. metals consumed by economic growth, i.e. cyclical metals.
On the negative side, you can see that crude oil has been a holdout due to its own unique supply/demand fundamentals, subject as they are to a world at war and/or at increasing geopolitical tensions. I expect that this too shall pass eventually, and when it does gold miners will get a bottom line operational benefit as this mining cost driver eases in relation to the mining product. However, the price at the pump has helped drive inflation expectations to furious highs lately and the CRB index is still trending up, driven by oil as it is. Aside from energy stocks (on a stiff correction within an uptrend), many commodity producers are breaking down, however.
Gold mining fundamentals by this chart are improving rapidly, but still incomplete. This would not preclude them from rallying because stocks tend to look ahead. If they rally they could well be looking ahead and seeing gold bottom and turn up vs. more mining cost drivers. As for stock markets and other commodities, players in those markets are already turning toward gold. It’s more of a psychological thing, as stocks aren’t working, bonds aren’t working and so what is left?
That is the makings of a gold bull market, not as part of the inflation trades.
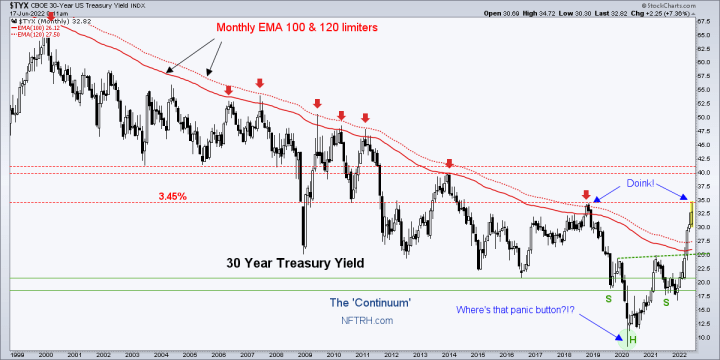
I invite you to join NFTRH (now available through simple credit card signup in addition to PayPal and other options) to be on the right side of a changing macro. The above is one small snapshot of change, but there are sure to be many more assumptions forged in the past that will need revision in the future. It’s an exciting time to be a market manager. Not says I, but says the likes of this chart of the 30 year Treasury yield’s broken relationship with its monthly EMA 100 & 120, to name just one.
Bottom Line for Gold/Miners
A macro turn is in progress and not yet complete. The coming cycle will include new inputs and investors should not have automatic or robotic thinking, especially about inflation as it relates to gold. The seasonal, which is a moving target at best in any given year, does not bottom until July, but sentiment has been hammered and the macro cycle is turning negative and so too is confidence, which is the best case for gold.
One notable vulnerability remains; that is the fact that most gold bugs are also inflation bugs, so we should keep in mind that if the markets experience what nobody currently expects, a severe drop in liquidity and inflation expectations (i.e. a deflationary episode) many gold mining bulls will probably sell for the wrong reasons (as gold rises in relation to mining costs and a failing macro in general). An inflationary failure does not appear likely, but that’s the whole point. The majority of gold stock bulls have been frustrated inflationists since mid-2020. Q4 2008 provides a handy example of what happens when the inflation bugs take a final wipe out.
Read Full Story »»»
DiscoverGold
Friday was quad expiration, most of the 3T went into bonds, a couple indexes, and miners, didnt see any at all go into crypto. BTC failed that test friday, I thought it would see a nice bounce, even though it always creeps up when there is recovery in Naz, expect BTC and NaZ to go up, they got heads in the sand and may not come out until fall. Gold and silver, who knows, its time has come but will it?
Jack Chan: Gold Price Exclusive Update
By: Jack Chan | June 18, 2022

Our proprietary cycle indicator is down.
To public readers of our updates, our cycle indicator is one of the most effective timing tool for traders and investors. It is not perfect, because periodically the market can be more volatile and can result in short term whipsaws. But overall, the cycle indicator provides us with a clear direction how we should be speculating.
Investors
During a major buy signal, investors can accumulate positions by cost averaging at cycle bottoms, ideally when prices are at or near the daily 200ema.
During a major sell signal, investors should be hedged or in cash.
Traders
Simply cost average in at cycle bottoms when prices are at or near the daily 200ema; and cost average out at cycle tops when prices are above the daily 50ema.

Gold sector is on long term BUY signal, suggesting that the correction since 2020 has been completed.

GLD is on short term sell signal.

GDX is on short term sell signal.

XGD.to is on short term sell signal.

GDXJ is on short term sell signal.
Analysis

Speculation now at the lowest level in two years.

Our ratio is on sell signal.

Trend is up for the dollar.

$HUI broke support this week.

Gold is holding support.

Support and resistance are now well defined.

GDX is testing support again.
Summary
Long term – on BUY signal.
Short term – on sell signals.
Gold sector cycle is down.
$$$ We are holding a core position as long as $HUI remains on long term buy.
Read Full Story »»»
DiscoverGold
Metals Still Have Not Proven Themselves – But Are Likely VERY Close
By: Avi Gilburt | June 16, 2022
• Following the Elliott Wave analysis:
The metals have still not proven there are going to imminently embark upon the next major rally phase. But, we are very close based upon all the charts I am reviewing.
With the move lower thus far, GDX has pushed a bit lower, and if we are able to break down below 28.63, then we have a reset as represented by the yellow count. This would allow us an opportunity for a more impulsive rally asset up in the [c] wave in yellow, which would likely take shape as an impulsive rally structure, and provide us with a higher probability long trade set up. To support this perspective, please note the positive divergence on the MACD on the daily chart, which suggests that the bottoming structure is likely near completion whether we get that lower low or not. But, should we get that lower low, it does reset the count and potentially allow for a more aggressive trading structure to take shape should we see that lower low followed by a 5-wave rally structure in the first wave of the yellow [c] wave.
As far as GLD, I still think any rally will still likely take shape as an 5th wave in an ending diagonal, as shown on the daily chart attached.
And, as far as silver, the lower low still remains a strong probability on the chart, unless we see a strong break out through the downtrend channel in a clear 5-wave structure. So, if the market provides us with a smaller degree 1-2 upside set up which then breaks out through the micro pivot, one can set a stop on a short term trade just below the pivot if you want to get aggressive to trade a potential wave i off the lows towards the 25+ region.
In very simple terms, I would likely still prefer just a bit lower in the overall complex, especially if it would re-set the count in the GDX. But, by no means am I shorting for that potential, as I see this as a buying opportunity for an impending rally I expect to take hold in the 2nd half of 2022.

GDXdaily

GLDdaily

Silver-144min
Read Full Story »»»
DiscoverGold
very good chance.
NY Gold Futures »» Weekly Summary Analysis
By: Marty Armstrong | June 18, 2022
This market made a new high today after the past 3 trading days. The market opened higher and closed lower. The immediate trading pattern in this market has exceeded the previous session's high intraday reaching 186150. Therefore, this market closed below the opening print while also closing down from the previous closing yet it was weak going into the close.
One indicator typical technicians follow is the 200 day moving average which the market has just moved back above 1 day ago. That number rested today at 184288. Historically, this indicator is more broad-term in what it reveals. It can flip back to negative after a few days.
Clearly, this market has broken under the former broader cyclical support which now resides above the market at 184711 rendering it vulnerable to a further decline at this time. The market just crossed that cyclical support during the previous session.
During the last session, we did close above the previous session's Intraday Crash Mode support indicator which was 177135 settling at 184990. The current Crash Mode support for this session was 179424 which we closed above at this time. The Intraday Crash indicator for the next session will be 182450. Remember, opening below this number in the next session will warn that the market may enter an abrupt panic sell-off to the downside. Now we have been holding above this indicator in the current trading session, and it resides lower for the next session. If the market opens above this number and holds above it intraday, then we are consolidating. Prevailing above this session's low will be important to indicate the market is in fact holding. However, a break of this session's low of 183610 and a closing below that will warn of a continued decline remains possible. The Secondary Intraday Crash Mode support lies at 178930 which we are trading above at this time. A breach of this level with a closing below will signal a sharp decline is possible.
Intraday Projected Crash Mode Points
Today...... 179424
Previous... 177135
Tomorrow... 182450
This market has not closed above the previous cyclical high of 188250. Obviously, it is pushing against this resistance level.
ECONOMIC CONFIDENCE MODEL CORRELATION
Here in NY Gold Futures, we do find that this particular market has correlated with our Economic Confidence Model in the past. The Last turning point on the ECM cycle low to line up with this market was 2015. The Last turning point on the ECM cycle high to line up with this market was 2020 and 2011 and 1996.
MARKET OVERVIEW
NEAR-TERM OUTLOOK
The historical perspective in the NY Gold Futures included a rally from 2015 moving into a major high for 2020, the market has been consolidating since the major high with the last significant reaction low established back in 2015. The market is still holding above last year's low. The last Yearly Reversal to be elected was a Bullish at the close of 2020.
This market remains in a positive position on the weekly to yearly levels of our indicating models.
From a perspective using the indicating ranges on the Daily level in the NY Gold Futures, this market remains moderately bullish currently with underlying support beginning at 183760 and overhead resistance forming above at 185880. The market is trading closer to the support level at this time.
On the weekly level, the last important high was established the week of June 13th at 188250, which was up 4 weeks from the low made back during the week of May 16th. So far, this week is trading within last week's range of 188250 to 180610. Nevertheless, the market is still trading downward more toward support than resistance. A closing beneath last week's low would be a technical signal for a correction to retest support.
Looking at this from a broader perspective, this last rally into the week of June 13th reaching 188250 failed to exceed the previous high of 200300 made back during the week of April 18th. That rally amounted to only four weeks. Right now, the market is neutral on our weekly Momentum Models warning we have overhead resistance forming and support in the general vacinity of 183630. Additional support is to be found at 179720. Looking at this from a wider perspective, this market has been trading up for the past 11 weeks overall.
INTERMEDIATE-TERM OUTLOOK
YEARLY MOMENTUM MODEL INDICATOR
Our Momentum Models are declining at this time with the previous high made 2020 while the last low formed on 2021. However, this market has rallied in price with the last cyclical high formed on 2020 and thus we have a divergence warning that this market is starting to run out of strength on the upside.
Critical support still underlies this market at 175200 and a break of that level on a monthly closing basis would warn that a sustainable decline ahead becomes possible. Immediately, the market is trading within last month's trading range in a neutral position.
DiscoverGold COT - Commitments of Traders in Metals Futures Market Reports
By: Software North | June 17, 2022
Gold
Silver
Read Full Story »»»
DiscoverGold
Gold Stocks: Double Bottom Launchpads
By: Morris Hubbartt | June 17, 2022
Super Force Signals (SFS) is being rebranded as Super Gold Signals (SGS at https://supergoldsignals.com), to reflect the growing global importance of gold.
I cover the senior miners, commodities, and the Dow in my flagship SGS newsletter. A Fed Funds rate at 1.6% is not going to stop inflation that is somewhere between 8% and 15%. The war in Ukraine is a quagmire and tension is high going into our US election. There is opportunity for investors! At $249 a year, subscribers love the SGS value. I'm offering an inflation special of a full 14 months for just $199. Send me an email if you want the offer and I'll get you onboard. Thanks!
SG60 Key Charts, Signals, & Video Analysis
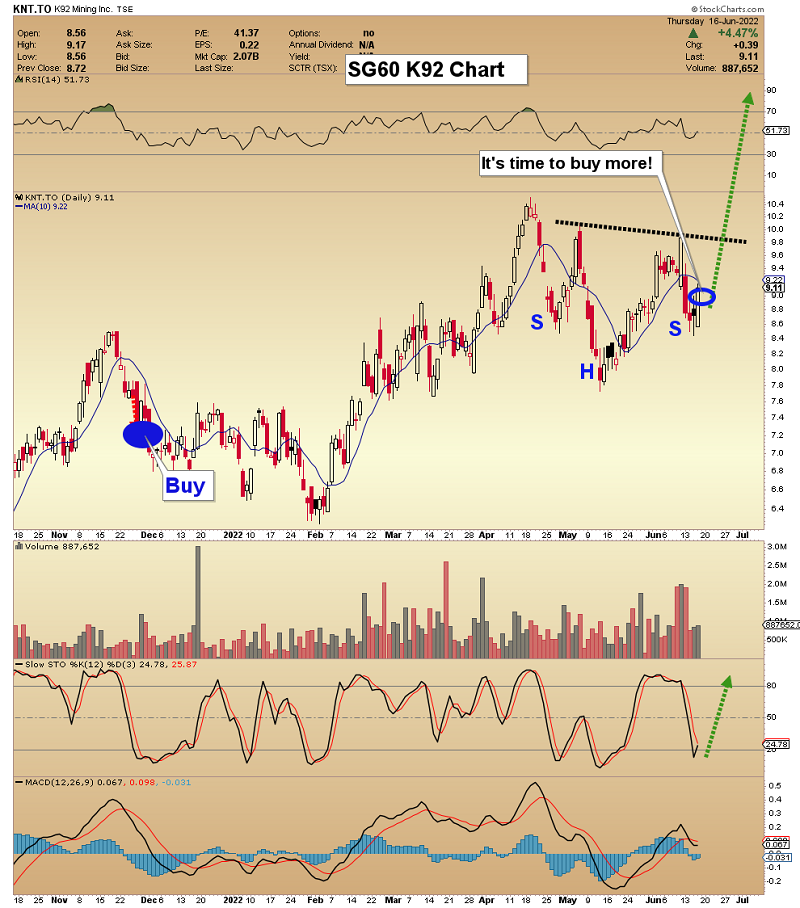
SGT Key Charts, Signals, & Video Analysis
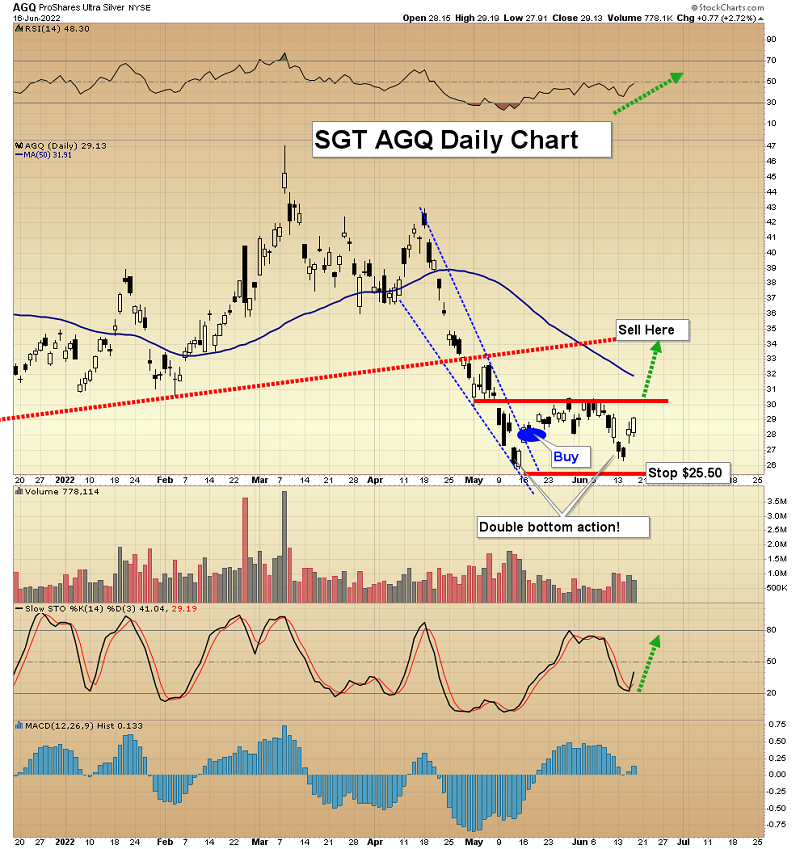
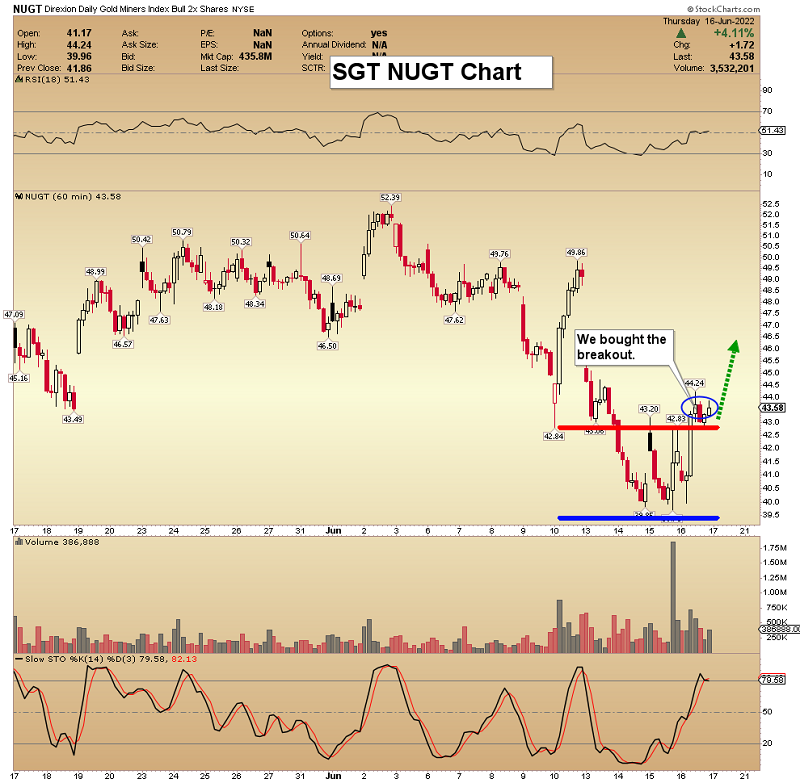
SGJ Key Charts, Signals, & Video Analysis
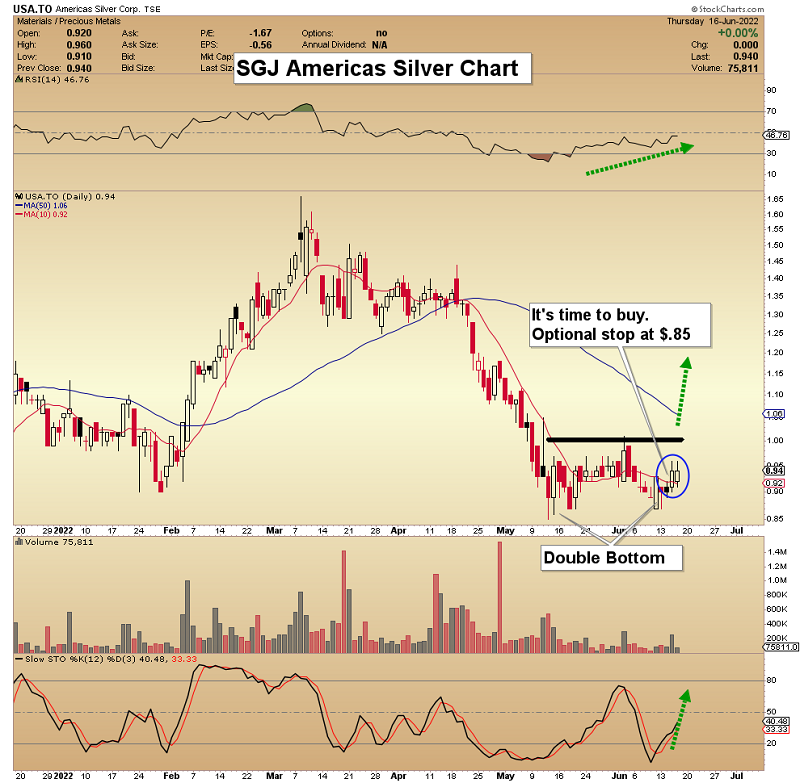
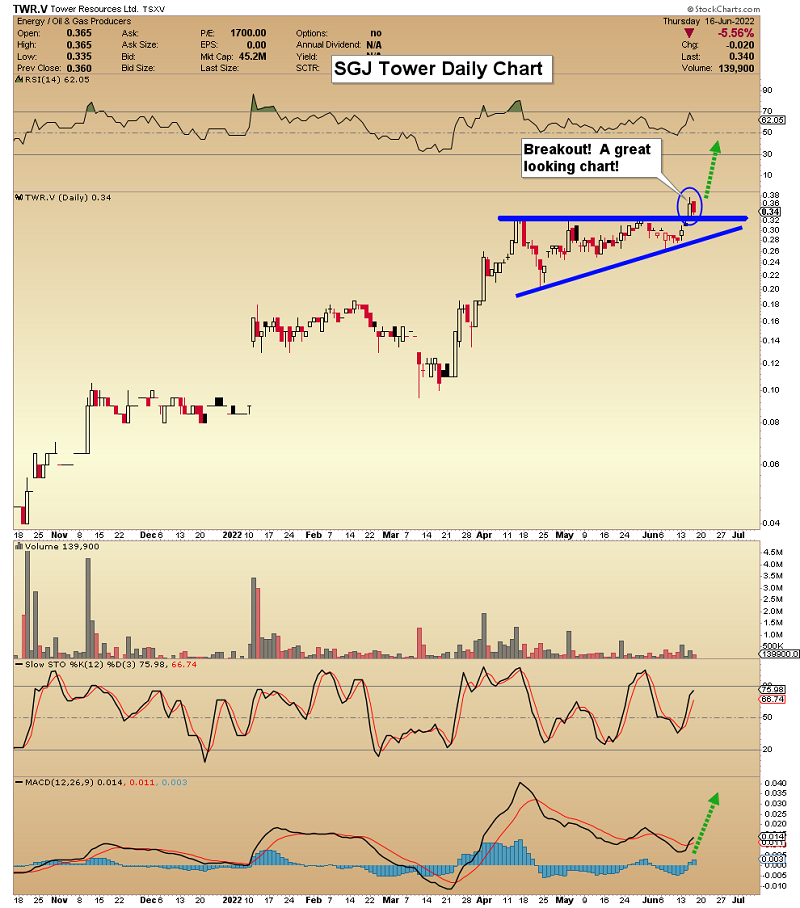
Read Full Story »»»
DiscoverGold
It’s actually marching to the beat of the feds bots, or traders, or both. I can prove it. Just watching to see it break.
expectations now are dummied down so obscenely low. Even this guy prices things too conservatively.....gold is the next bitcoin and it will be, you will see. The electronic nonsense is basically over.
from Yahoo
Philip
yesterday
May I draw your attention to something . Let's take the chart of GDX ! Take the max duration . You can see that in the years 2006 , 2007 ...GDX was valued at 40 usd !! That was the time gold price was at 700 usd and the miners had a lot of debt , in 2006 miners took 150 usd profit per ounce ! Now in 2022 , gold price is at 1835 usd , the profit per ounce for miners is 735 usd (the aisc is 1100 usd for the average gold miner) and .....GDX is at ...30 usd !!!?? The gold miners are still incredibly undervalued and the upward potential is huge ! Conclusion ...a GDX price as in 2006 around 40 usd would be fair and even not expensive ! Maybe young people , who weren't investors in 2006 , should study history about commodities in general and certainly about gold ! Buy GDX now at 30-35 usd and do nothing ...just wait 3 years !
"Rah Rah, Go Team go!
this is her screen hollywood debut, an incredible woman, everything she did, so talented...died young of cancer.
big fan.
could play any role, to contrast, see her in the Omen as a mature woman, to take just one example.
Rah Rah Mama Guitar. \
a brilliant culture, the greatest the world has ever know, greater by far than the Greeks in the 5th and 4th century, in the age of Themistocles ...way way back there in second place.
but your central observation is correct: gold and the miners are not acting "hoppy" or jumpy; actually quite the reverse, but this has been going on now for 1.5 years give or take.
It won't stay that way much longer...weeks a few months.
|
Followers
|
148
|
Posters
|
|
|
Posts (Today)
|
0
|
Posts (Total)
|
5650
|
|
Created
|
06/29/08
|
Type
|
Free
|
| Moderators DiscoverGold trunkmonk | |||

http://www.vaneck.com/index.cfm?cat=3192&tkr=GDX&LN=3-02
The Gold Miners ETF seeks to replicate as closely as possible, before fees and expenses, the price and yield performance of the NYSE Arca Gold Miners Index. The Index provides exposure to publicly traded companies worldwide involved primarily in the mining for gold, representing a diversified blend of small-, mid- and large-capitalization stocks. As such, the Fund is subject to the risks of investing in this sector.
| ||||||||||||||||||||||||||||||||||||||||||||||||||||||||||||||||||||||||||||||||||||||||||||||||||||||
| DAILY |
| WEEKLY |
| Volume | |
| Day Range: | |
| Bid Price | |
| Ask Price | |
| Last Trade Time: |


