


Saturday, April 07, 2012 1:27:04 AM
~ IAMLEGEND STOCK LESSON ~ " HEAD AND SHOULDER'S PATTERN"
~ CLICK ON THE LINK BELOW TO SEE A COMPLETE LIST OF STOCK LESSON'S ~
http://investorshub.advfn.com/boards/read_msg.aspx?message_id=74130197
Head and Shoulders
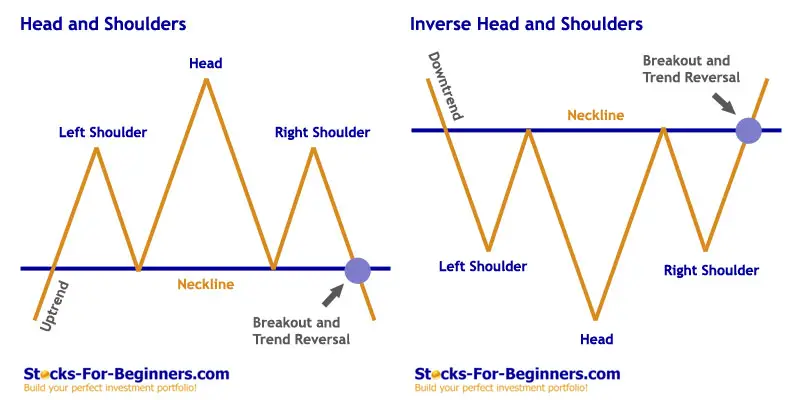
A head and shoulders pattern consists of a peak followed by a higher peak and then a lower peak with a break below the neckline. The neckline is drawn through the lowest points of the two intervening troughs and may slope upward or downward. A downward sloping neckline is more reliable as a signal.
2 Types of Head and shoulders- TOP & BOTTOM
1.Head and Shoulders Top (Reversal)
A Head and Shoulders reversal pattern forms after an uptrend, and its completion marks a trend reversal. The pattern contains three successive peaks with the middle peak (head) being the highest and the two outside peaks (shoulders) being low and roughly equal. The reaction lows of each peak can be connected to form support, or a neckline.

1. Prior Trend: It is important to establish the existence of a prior uptrend for this to be a reversal pattern. Without a prior uptrend to reverse, there cannot be a Head and Shoulders reversal pattern (or any reversal pattern for that matter).
2. Left Shoulder: While in an uptrend, the left shoulder forms a peak that marks the high point of the current trend. After making this peak, a decline ensues to complete the formation of the shoulder (1). The low of the decline usually remains above the trend line, keeping the uptrend intact.
3. Head: From the low of the left shoulder, an advance begins that exceeds the previous high and marks the top of the head. After peaking, the low of the subsequent decline marks the second point of the neckline (2). The low of the decline usually breaks the uptrend line, putting the uptrend in jeopardy.
4. Right Shoulder: The advance from the low of the head forms the right shoulder. This peak is lower than the head (a lower high) and usually in line with the high of the left shoulder. While symmetry is preferred, sometimes the shoulders can be out of whack. The decline from the peak of the right shoulder should break the neckline.
5. Neckline: The neckline forms by connecting low points 1 and 2. Low point 1 marks the end of the left shoulder and the beginning of the head. Low point 2 marks the end of the head and the beginning of the right shoulder. Depending on the relationship between the two low points, the neckline can slope up, slope down or be horizontal. The slope of the neckline will affect the pattern's degree of bearishness: a downward slope is more bearish than an upward slope. Sometimes more than one low point can be used to form the neckline.
6. Volume: As the Head and Shoulders pattern unfolds, volume plays an important role in confirmation. Volume can be measured as an indicator (OBV, Chaikin Money Flow) or simply by analyzing volume levels. Ideally, but not always, volume during the advance of the left shoulder should be higher than during the advance of the head. This decrease in volume and the new high of the head, together, serve as a warning sign. The next warning sign comes when volume increases on the decline from the peak of the head. Final confirmation comes when volume further increases during the decline of the right shoulder.
7. Neckline Break: The head and shoulders pattern is not complete and the uptrend is not reversed until neckline support is broken. Ideally, this should also occur in a convincing manner, with an expansion in volume.
8. Support Turned Resistance: Once support is broken, it is common for this same support level to turn into resistance. Sometimes, but certainly not always, the price will return to the support break, and offer a second chance to sell.
9. Price Target: After breaking neckline support, the projected price decline is found by measuring the distance from the neckline to the top of the head. This distance is then subtracted from the neckline to reach a price target. Any price target should serve as a rough guide, and other factors should be considered as well. These factors might include previous support levels, Fibonacci retracements, or long-term moving averages.


2. Head and Shoulders Bottom (Reversal)
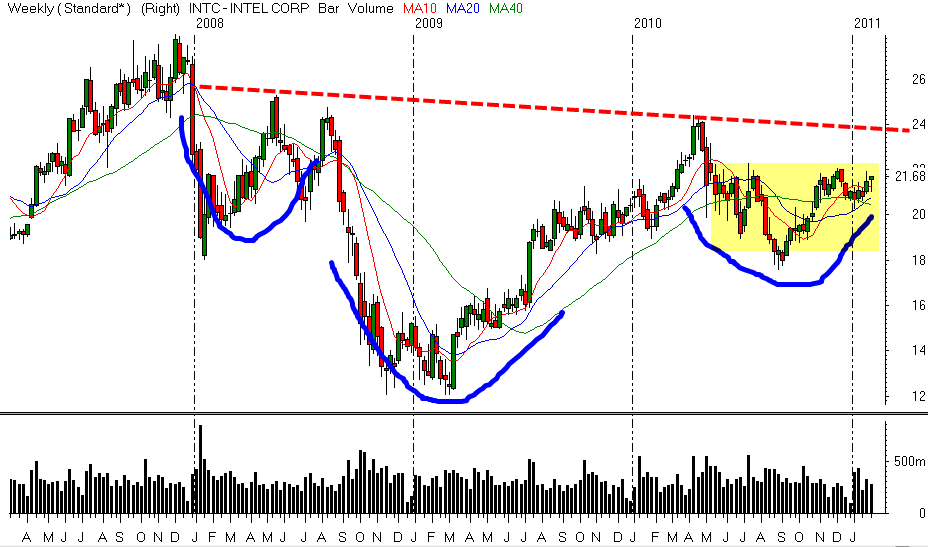
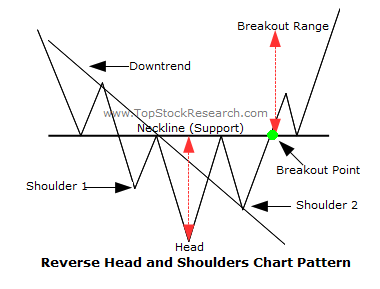
As a major reversal pattern, the Head and Shoulders Bottom forms after a downtrend, and its completion marks a change in trend. The pattern contains three successive troughs with the middle trough (head) being the deepest and the two outside troughs (shoulders) being shallower. Ideally, the two shoulders would be equal in height and width. The reaction highs in the middle of the pattern can be connected to form resistance, or a neckline.

A valley is formed (shoulder), followed by an even lower valley (head), and then another higher valley (shoulder). These formations occur after extended downward movements.

Here you can see that this is just like a head and shoulders pattern, but it's flipped upside down. With this formation, we would place a long entry order above the neckline.
Our target is calculated just like the head and shoulders pattern. Measure the distance between the head and the neckline, and that is approximately the distance that the price will move after it breaks the neckline.

You can see that the price moved up nicely after it broke the neckline.
If your target is hit, then be happy with your profits. However, there are trade management techniques where you can lock in some of your profits and still keep your trade open in case the price continues to move your way.
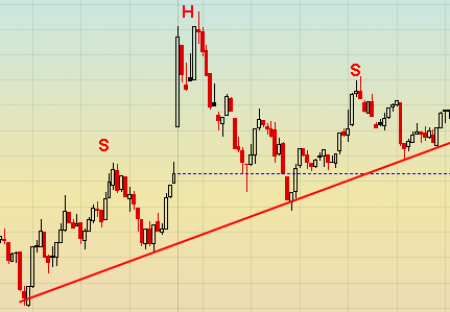
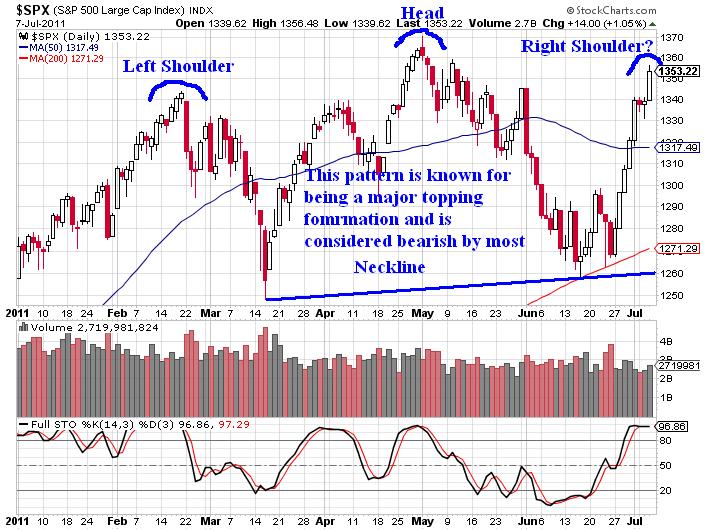
Examples:


Video's
PART 1.
PART 2.
~ CLICK ON THE LINK BELOW TO SEE A COMPLETE LIST OF STOCK LESSON'S ~
http://investorshub.advfn.com/boards/read_msg.aspx?message_id=74130197
Head and Shoulders
A head and shoulders pattern consists of a peak followed by a higher peak and then a lower peak with a break below the neckline. The neckline is drawn through the lowest points of the two intervening troughs and may slope upward or downward. A downward sloping neckline is more reliable as a signal.

2 Types of Head and shoulders- TOP & BOTTOM
1.Head and Shoulders Top (Reversal)
A Head and Shoulders reversal pattern forms after an uptrend, and its completion marks a trend reversal. The pattern contains three successive peaks with the middle peak (head) being the highest and the two outside peaks (shoulders) being low and roughly equal. The reaction lows of each peak can be connected to form support, or a neckline.

1. Prior Trend: It is important to establish the existence of a prior uptrend for this to be a reversal pattern. Without a prior uptrend to reverse, there cannot be a Head and Shoulders reversal pattern (or any reversal pattern for that matter).
2. Left Shoulder: While in an uptrend, the left shoulder forms a peak that marks the high point of the current trend. After making this peak, a decline ensues to complete the formation of the shoulder (1). The low of the decline usually remains above the trend line, keeping the uptrend intact.
3. Head: From the low of the left shoulder, an advance begins that exceeds the previous high and marks the top of the head. After peaking, the low of the subsequent decline marks the second point of the neckline (2). The low of the decline usually breaks the uptrend line, putting the uptrend in jeopardy.
4. Right Shoulder: The advance from the low of the head forms the right shoulder. This peak is lower than the head (a lower high) and usually in line with the high of the left shoulder. While symmetry is preferred, sometimes the shoulders can be out of whack. The decline from the peak of the right shoulder should break the neckline.
5. Neckline: The neckline forms by connecting low points 1 and 2. Low point 1 marks the end of the left shoulder and the beginning of the head. Low point 2 marks the end of the head and the beginning of the right shoulder. Depending on the relationship between the two low points, the neckline can slope up, slope down or be horizontal. The slope of the neckline will affect the pattern's degree of bearishness: a downward slope is more bearish than an upward slope. Sometimes more than one low point can be used to form the neckline.
6. Volume: As the Head and Shoulders pattern unfolds, volume plays an important role in confirmation. Volume can be measured as an indicator (OBV, Chaikin Money Flow) or simply by analyzing volume levels. Ideally, but not always, volume during the advance of the left shoulder should be higher than during the advance of the head. This decrease in volume and the new high of the head, together, serve as a warning sign. The next warning sign comes when volume increases on the decline from the peak of the head. Final confirmation comes when volume further increases during the decline of the right shoulder.
7. Neckline Break: The head and shoulders pattern is not complete and the uptrend is not reversed until neckline support is broken. Ideally, this should also occur in a convincing manner, with an expansion in volume.
8. Support Turned Resistance: Once support is broken, it is common for this same support level to turn into resistance. Sometimes, but certainly not always, the price will return to the support break, and offer a second chance to sell.
9. Price Target: After breaking neckline support, the projected price decline is found by measuring the distance from the neckline to the top of the head. This distance is then subtracted from the neckline to reach a price target. Any price target should serve as a rough guide, and other factors should be considered as well. These factors might include previous support levels, Fibonacci retracements, or long-term moving averages.


2. Head and Shoulders Bottom (Reversal)
As a major reversal pattern, the Head and Shoulders Bottom forms after a downtrend, and its completion marks a change in trend. The pattern contains three successive troughs with the middle trough (head) being the deepest and the two outside troughs (shoulders) being shallower. Ideally, the two shoulders would be equal in height and width. The reaction highs in the middle of the pattern can be connected to form resistance, or a neckline.

A valley is formed (shoulder), followed by an even lower valley (head), and then another higher valley (shoulder). These formations occur after extended downward movements.

Here you can see that this is just like a head and shoulders pattern, but it's flipped upside down. With this formation, we would place a long entry order above the neckline.
Our target is calculated just like the head and shoulders pattern. Measure the distance between the head and the neckline, and that is approximately the distance that the price will move after it breaks the neckline.

You can see that the price moved up nicely after it broke the neckline.
If your target is hit, then be happy with your profits. However, there are trade management techniques where you can lock in some of your profits and still keep your trade open in case the price continues to move your way.
Examples:


Video's
PART 1.
PART 2.

Join the InvestorsHub Community
Register for free to join our community of investors and share your ideas. You will also get access to streaming quotes, interactive charts, trades, portfolio, live options flow and more tools.

