Moving Average Convergence-Divergence (MACD)Developed by Gerald Appel in the late seventies, the Moving Average Convergence-Divergence (MACD) indicator is one of the simplest and most effective momentum indicators available. The MACD turns two trend-following indicators, moving averages, into a momentum oscillator by subtracting the longer moving average from the shorter moving average. As a result, the MACD offers the best of both worlds: trend following and momentum. The MACD fluctuates above and below the zero line as the moving averages converge, cross and diverge. Traders can look for signal line crossovers, centerline crossovers and divergences to generate signals. The MACD Line is the 12-day Exponential Moving Average (EMA) less the 26-day EMA. Closing prices are used for these moving averages. A 9-day EMA of the MACD Line is plotted with the indicator to act as a signal line and identify turns. The MACD Histogram represents the difference between MACD and its 9-day EMA, the Signal line. The histogram is positive when the MACD Line is above its Signal line and negative when the MACD Line is below its Signal line.
The values of 12, 26 and 9 are the typical setting used with the MACD, however other values can be substituted depending on your trading style and goals.
MACD Line: (12-day EMA - 26-day EMA)
Signal Line: 9-day EMA of MACD Line
MACD Histogram: MACD Line - Signal Line
The MACD is all about the convergence and divergence of the two moving averages. Convergence occurs when the moving averages move towards each other. Divergence occurs when the moving averages move away from each other. The shorter moving average (12-day) is faster and responsible for most MACD movements. The longer moving average (26-day) is slower and less reactive to price changes in the underlying security. The MACD Line oscillates above and below the zero line, which is also known as the centerline. These crossovers signal that the 12-day EMA has crossed the 26-day EMA. The direction, of course, depends on direction of the moving average cross. Positive MACD indicates that the 12-day EMA is above the 26-day EMA. Positive values increase as the shorter EMA diverges further from the longer EMA. This means upside momentum is increasing. Negative MACD values indicates that the 12-day EMA is below the 26-day EMA. Negative values increase as the shorter EMA diverges further below the longer EMA. This means downside momentum is increasing.
Signal Line Crossovers Centerline Crossovers
Divergences
Divergences form when the MACD diverges from the price action of the underlying security. A bullish divergence forms when a security records a lower low and the MACD forms a higher low. The lower low in the security affirms the current downtrend, but the higher low in the MACD shows less downside momentum. Despite less downside momentum, downside momentum is still outpacing upside momentum as long as the MACD remains in negative territory. Slowing downside momentum can sometimes foreshadows a trend reversal or a sizable rally.
Divergences should be taken with caution. Bearish divergences are commonplace in a strong uptrend, while bullish divergences occur often in a strong downtrend. Yes, you read that right. Uptrends often start with a strong advance that produces a surge in upside momentum (MACD). Even though the uptrend continues, it continues at a slower pace that causes the MACD to decline from its highs. Upside momentum may not be as strong, but upside momentum is still outpacing downside momentum as long as the MACD Line is above zero. The opposite occurs at the beginning of a strong downtrend.
VIDEO-MACD
PART 1
PART 2
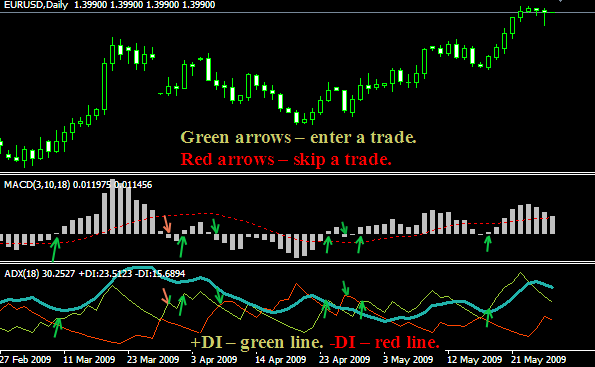
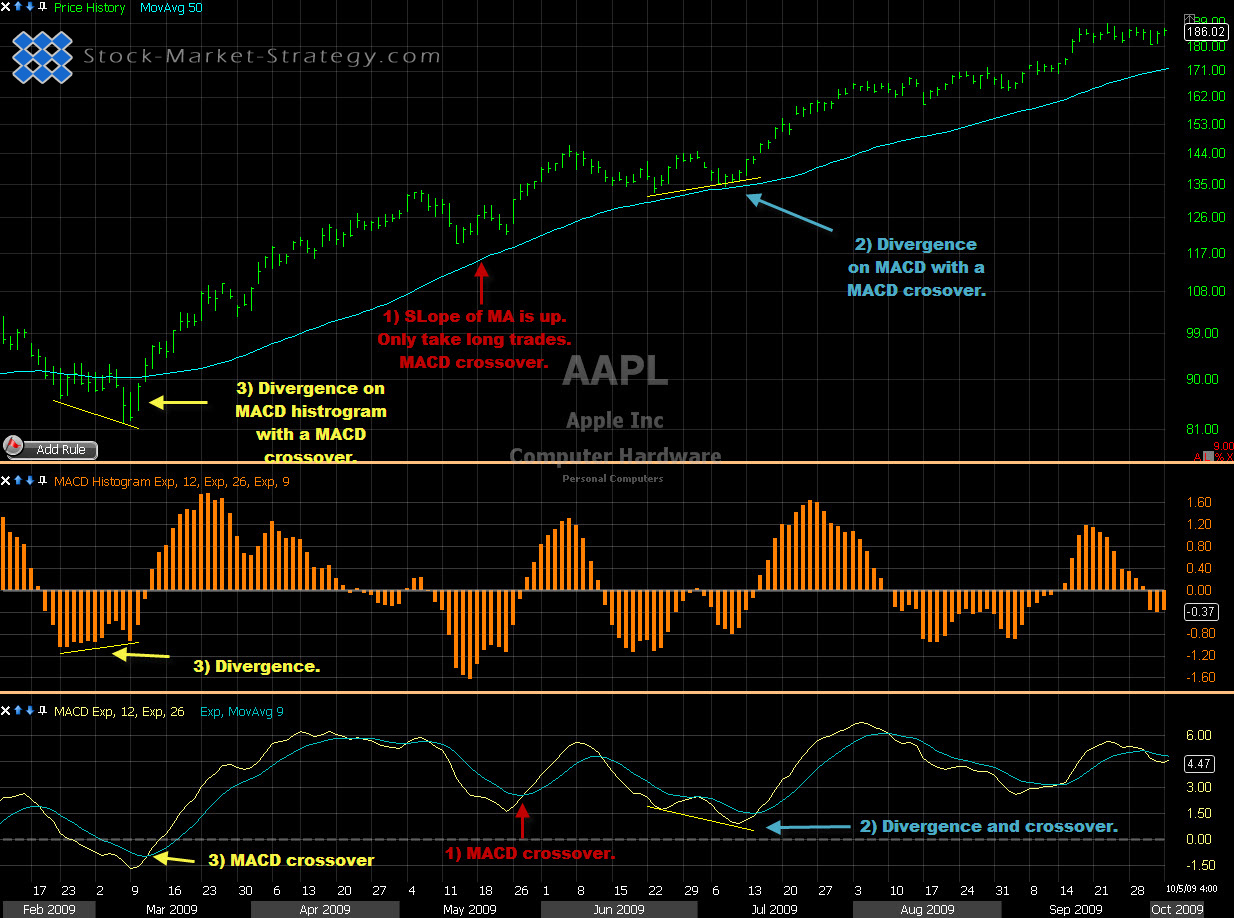
EXAMPLES
* 20% Profit Rule * Do your DD * Follow the Charts-Trend * Stop loss * Buy at Support,Sell at Resistance * Dont chase momentum stocks * Control Fear & Greed
Register for free to join our community of investors and share your ideas. You will also get access to streaming quotes, interactive charts, trades, portfolio, live options flow and more tools.
 News
News  Market Data
  Discover