


Thursday, October 22, 2009 5:36:20 AM
HUI Gold Mining Stocks: Major Uptrend In Progress -
The major trend move underway in the Gold Bugs Index -
Although they're more volatile than Gold, if you can position
yourself on the 'right' side of their dominant trend,
investments in fundamentally sound Gold mining shares can be
even more profitable than investing in physical Gold.
Here's a look at the major trend move underway in the Gold
Bugs index, one of the most widely regarded indexes that
scores of precious metals equity traders and investors
rely on.
My, how times do change. Less than a year ago, the share
prices of virtually every senior and junior Gold mining
company were on the proverbial 'ash heap,' and some market
analysts had doubts that the bull run in the precious metals
sector would ever regain a solid footing, much less soar
to new highs.
And yet, that's just what happened - a complete recovery
across the entire sector (including Silver and Silver mining
companies, too), with Gold now at all-time highs and Silver
up more than 100% in less than 12 months.
Even better for those who trade Gold mining stocks,
the Gold Bugs index (which tracks the performance of some
of the biggest and most fundamentally sound Gold miners)
is up a mind-jarring 200% since October 2008 -
and the uptrend doesn't appear to be waning yet.
Let's have a closer look at the weekly technical chart of
the Gold Bugs index and examine the key trend indicators
as see what they may be telling us about the future
trajectory of prices for this volatile and potentially
profitable sector of the market.
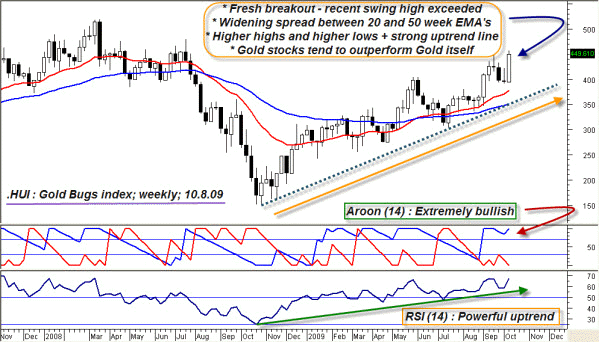
Graphic credit: Metastock v.11
Let's start at the top of the chart to focus on recent
developments first;
note the huge, wide-range weekly candle that just printed,
one that took out the prior weekly swing high of 448.31.
As you probably know, the very definition of an 'uptrend'
is that a stock, commodity or index must have a series of
higher highs and higher lows, and that's exactly what we
see on this weekly chart of the Gold Bugs index.
Now, look just below the recent weekly candle and witness
the ever-increasing spread between the 20-week (red line)
and the 50-week (blue line) exponential moving averages
(EMA's).
Note how they are both sloping upward and that the spread
between them is also increasing at a steady rate;
this is a sign of increasing upward momentum in the index.
Moving toward the lower area of the chart, notice that the Aroon (14) trend intensity index is solidly biased toward
the bullish side of its range (when the blue line is above
the red line and both lines are at opposing extremes, a
powerful uptrend is in motion) even as the Relative Strength
index (RSI)(14) is also in a powerful uptrend.
It's also interesting to note that RSI readings above 60
are usually indicative of a powerful trend move, and with
a current reading of 66.94, we can therefore conclude that
this latest rally in the Gold Bugs index is no fluke.
An interesting side note: Gold (cash basis) is up about 48%
since making a major low late last year (at about $713), but
did you notice that Gold stocks (as represented by the Gold
Bugs index) posted gains of about four times as much during
the same time period?
Does this mean that the shares of Gold mining companies are on
a non-stop ride toward ever-increasing gains?
Not necessarily; in fact, there are strong overhead
resistance areas near 479 and then 520 that will likely act
as (temporary?) consolidation and/or reversal point for
the index.
However, with the monthly chart of the Gold Bugs index
(not shown) also displaying powerful trend characteristics,
there can be little doubt that either of those key resistance
areas will eventually be challenged.
A solid break above 520.00 puts the Gold Bugs index into an
extremely bullish posture, and that's a price level that all
Gold equity traders will be monitoring in the weeks and
months to come.
If the price of Gold also continues to rise (it also
featuring many of the same bullish trend characteristics of
the Gold Bugs index), that will also be extremely favorable
toward those trading the shares of the biggest and most
fundamentally attractive Gold mining companies.
This may be the most exciting time to be a Gold/Gold stock
trader since at least 1979-1980, and if current trends keep
strengthening, we may be on the threshold of an era in the
precious metals markets that will be talked about for
generations to come.
Stay tuned - it's sure to be a fascinating and potentially
profitable time to be involved with the precious metals
markets!
Got RMK - EX..GOLD Spot fiatz$ 10,000.-/oz
ex..
http://investorshub.advfn.com/boards/board.aspx?board_id=1499
Gold Spot (FOREX:XAUUSDO) fiatz$ 1063.90/oz bargain
Last trade 1063.90 Change +0.13 (+0.01%)
Open 1063.77 Previous Close 1063.77
High 1063.99 Low 1063.50
Bid 1063.90 Ask 1064.39
2009-10-15 00:20:46, 0 min delay
Got Gold hard rock treasures -
ex..of a Gold venture penny play
CQRLF - The Calm Before The Run
LexLuthor
Drilling has begun.
I believe GoldCorp is watching this company very close.
This is stock is currently under the radar
and should gain some attention very soon.
Drilling results have to be positive.
Stay tuned......
well, CQR still an Ausome bargain..
dd..listen to..
Presentation by John F. Kearney, Conquest's Chairman on "InvestmentPitch.com"....
http://www.investmentpitch.com/media/514/Conquest_Resources_Ltd.__TSXV_CQR/
WHY RED LAKE GOLD BELT?
http://investorshub.advfn.com/boards/read_msg.aspx?message_id=41185478
http://investorshub.advfn.com/boards/read_msg.aspx?message_id=41481973
http://investorshub.advfn.com/boards/board.aspx?board_id=11788
imo. tia.
God Bless
The major trend move underway in the Gold Bugs Index -
Although they're more volatile than Gold, if you can position
yourself on the 'right' side of their dominant trend,
investments in fundamentally sound Gold mining shares can be
even more profitable than investing in physical Gold.
Here's a look at the major trend move underway in the Gold
Bugs index, one of the most widely regarded indexes that
scores of precious metals equity traders and investors
rely on.
My, how times do change. Less than a year ago, the share
prices of virtually every senior and junior Gold mining
company were on the proverbial 'ash heap,' and some market
analysts had doubts that the bull run in the precious metals
sector would ever regain a solid footing, much less soar
to new highs.
And yet, that's just what happened - a complete recovery
across the entire sector (including Silver and Silver mining
companies, too), with Gold now at all-time highs and Silver
up more than 100% in less than 12 months.
Even better for those who trade Gold mining stocks,
the Gold Bugs index (which tracks the performance of some
of the biggest and most fundamentally sound Gold miners)
is up a mind-jarring 200% since October 2008 -
and the uptrend doesn't appear to be waning yet.
Let's have a closer look at the weekly technical chart of
the Gold Bugs index and examine the key trend indicators
as see what they may be telling us about the future
trajectory of prices for this volatile and potentially
profitable sector of the market.
Graphic credit: Metastock v.11
Let's start at the top of the chart to focus on recent
developments first;
note the huge, wide-range weekly candle that just printed,
one that took out the prior weekly swing high of 448.31.
As you probably know, the very definition of an 'uptrend'
is that a stock, commodity or index must have a series of
higher highs and higher lows, and that's exactly what we
see on this weekly chart of the Gold Bugs index.
Now, look just below the recent weekly candle and witness
the ever-increasing spread between the 20-week (red line)
and the 50-week (blue line) exponential moving averages
(EMA's).
Note how they are both sloping upward and that the spread
between them is also increasing at a steady rate;
this is a sign of increasing upward momentum in the index.
Moving toward the lower area of the chart, notice that the Aroon (14) trend intensity index is solidly biased toward
the bullish side of its range (when the blue line is above
the red line and both lines are at opposing extremes, a
powerful uptrend is in motion) even as the Relative Strength
index (RSI)(14) is also in a powerful uptrend.
It's also interesting to note that RSI readings above 60
are usually indicative of a powerful trend move, and with
a current reading of 66.94, we can therefore conclude that
this latest rally in the Gold Bugs index is no fluke.
An interesting side note: Gold (cash basis) is up about 48%
since making a major low late last year (at about $713), but
did you notice that Gold stocks (as represented by the Gold
Bugs index) posted gains of about four times as much during
the same time period?
Does this mean that the shares of Gold mining companies are on
a non-stop ride toward ever-increasing gains?
Not necessarily; in fact, there are strong overhead
resistance areas near 479 and then 520 that will likely act
as (temporary?) consolidation and/or reversal point for
the index.
However, with the monthly chart of the Gold Bugs index
(not shown) also displaying powerful trend characteristics,
there can be little doubt that either of those key resistance
areas will eventually be challenged.
A solid break above 520.00 puts the Gold Bugs index into an
extremely bullish posture, and that's a price level that all
Gold equity traders will be monitoring in the weeks and
months to come.
If the price of Gold also continues to rise (it also
featuring many of the same bullish trend characteristics of
the Gold Bugs index), that will also be extremely favorable
toward those trading the shares of the biggest and most
fundamentally attractive Gold mining companies.
This may be the most exciting time to be a Gold/Gold stock
trader since at least 1979-1980, and if current trends keep
strengthening, we may be on the threshold of an era in the
precious metals markets that will be talked about for
generations to come.
Stay tuned - it's sure to be a fascinating and potentially
profitable time to be involved with the precious metals
markets!
Got RMK - EX..GOLD Spot fiatz$ 10,000.-/oz
ex..
http://investorshub.advfn.com/boards/board.aspx?board_id=1499
Gold Spot (FOREX:XAUUSDO) fiatz$ 1063.90/oz bargain
Last trade 1063.90 Change +0.13 (+0.01%)
Open 1063.77 Previous Close 1063.77
High 1063.99 Low 1063.50
Bid 1063.90 Ask 1064.39
2009-10-15 00:20:46, 0 min delay
Got Gold hard rock treasures -
ex..of a Gold venture penny play
CQRLF - The Calm Before The Run
LexLuthor
Drilling has begun.
I believe GoldCorp is watching this company very close.
This is stock is currently under the radar
and should gain some attention very soon.
Drilling results have to be positive.
Stay tuned......
well, CQR still an Ausome bargain..
dd..listen to..
Presentation by John F. Kearney, Conquest's Chairman on "InvestmentPitch.com"....
http://www.investmentpitch.com/media/514/Conquest_Resources_Ltd.__TSXV_CQR/
WHY RED LAKE GOLD BELT?
http://investorshub.advfn.com/boards/read_msg.aspx?message_id=41185478
http://investorshub.advfn.com/boards/read_msg.aspx?message_id=41481973
http://investorshub.advfn.com/boards/board.aspx?board_id=11788
imo. tia.
God Bless

Join the InvestorsHub Community
Register for free to join our community of investors and share your ideas. You will also get access to streaming quotes, interactive charts, trades, portfolio, live options flow and more tools.

