


| Followers | 679 |
| Posts | 140700 |
| Boards Moderated | 37 |
| Alias Born | 03/10/2004 |
Tuesday, February 16, 2021 1:23:51 PM
By: TheStreet | February 16, 2021
• CVS Health is falling after reporting earnings. Is it an opportunity or is more downside coming? Let's look at the key levels.
CVS Health (CVS) was giving investors a potentially ugly trading setup on Tuesday, down about 4% after reporting earnings.
However, it’s the daily price that’s forming a concerning look. Shares are knifing right through several key moving averages while giving investors a bullish engulfing candle.
Without getting too technical, that occurs when the current candle opens above the prior day’s close, and closes below the prior day’s open. Ideally, the entire range of the second candle exceeds the range of the previous candle.
In other words, the candle is "engulfing" the prior day. It’ll be illustrated on the chart below.
While it’s still early in the week, CVS could also be setting up for a bearish engulfing weekly setup too.
Shares were selling off despite CVS topping fourth-quarter earnings and revenue expectations. However, full-year guidance for 2021 was slightly short of estimates.
Is that worth this type of dip? Let’s look at the chart.
Trading CVS
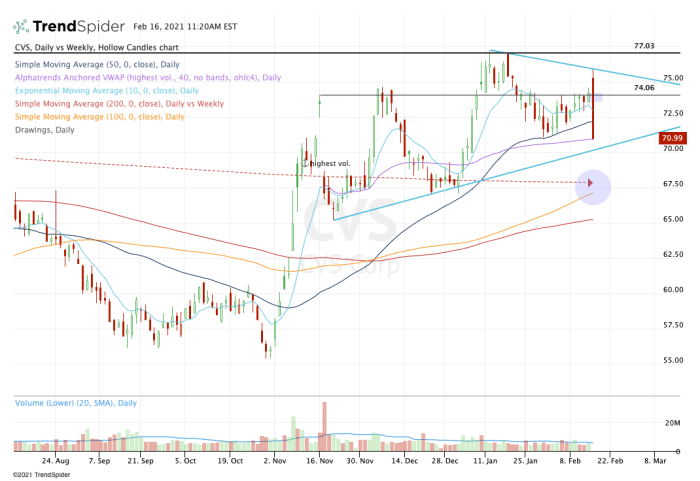
Daily chart of CVS stock.
Chart courtesy of TrendSpider.com
Notice how shares opened above the prior day’s range (including its high), then completely blew through the lows of the prior day. That’s not a great look. Nor is the fact that CVS stock dipped aggressively below the 50-day moving average.
Thankfully, VWAP support is stepping on the day. If shares can bounce off this level, it will at least give traders a downside level to measure against.
That support level will become even more compelling if CVS can reclaim the 50-day moving average. Should the 10-day and 50-day moving averages act as resistance, VWAP support will be vulnerable as bears harness control of the stock — at least in the short term.
What if the VWAP measure doesn’t act as support?
In that event, uptrend support (blue line) will be put in play, followed by the $67 to $68 area. Near the latter range, the stock finds its 100-day and 200-week moving averages. Reclaiming the latter was a significant development for long-term bulls, so to see it act as support would be a reaction to keep note of.
On the upside, let’s see if CVS stock can reclaim the 50-day moving average. Above it could put $74 in play, followed by a potential test of the $77 area, which is the 2019 high and a mark that wasn’t tested in 2020. However, it was resistance in January.
Here’s the bottom line: If the stock doesn’t hold current levels, look for a dip to the $67 to $68 area. In either scenario, bulls need to reclaim the 50-day moving average to get back in control, then clear $74.
Read Full Story »»»
 DiscoverGold
Information posted to this board is not meant to suggest any specific action, but to point out the technical signs that can help our readers make their own specific decisions. Caveat emptor!
• DiscoverGold
Recent CVS News
- Aetna Better Health of Michigan recommended for CHCP contract • PR Newswire (US) • 04/09/2024 04:00:00 PM
- CVS Health® expands pharmacy tuition assistance and scholarship programs • PR Newswire (US) • 04/03/2024 12:00:00 PM
- CVS Health to hold first quarter 2024 earnings conference call • PR Newswire (US) • 04/01/2024 01:00:00 PM
- CVS Health® invests more than $3M in organizations improving health outcomes in Phoenix • PR Newswire (US) • 03/27/2024 06:00:00 PM
- CVS Health announces quarterly dividend • PR Newswire (US) • 03/21/2024 02:55:00 PM
- AM Best Affirms Credit Ratings of Most of CVS Health Corporation’s Aetna Inc. Subsidiaries; Withdraws Credit Ratings of Members of Texas Health Aetna • Business Wire • 03/13/2024 09:03:00 PM
- Form 8-K - Current report • Edgar (US Regulatory) • 03/05/2024 11:09:28 AM
- Form 4 - Statement of changes in beneficial ownership of securities • Edgar (US Regulatory) • 03/01/2024 10:21:05 PM
- Form 4 - Statement of changes in beneficial ownership of securities • Edgar (US Regulatory) • 03/01/2024 10:20:02 PM
- Form 4 - Statement of changes in beneficial ownership of securities • Edgar (US Regulatory) • 03/01/2024 10:18:58 PM
- Form 4 - Statement of changes in beneficial ownership of securities • Edgar (US Regulatory) • 02/28/2024 09:37:48 PM
- CVS Health invests nearly $35 million in affordable housing in Hawai'i • PR Newswire (US) • 02/22/2024 01:45:00 AM
- CVS Health to participate at the 45nd Annual Raymond James Institutional Investors Conference • PR Newswire (US) • 02/21/2024 02:00:00 PM
- Form 4 - Statement of changes in beneficial ownership of securities • Edgar (US Regulatory) • 02/16/2024 11:46:48 PM
- Form 144 - Report of proposed sale of securities • Edgar (US Regulatory) • 02/16/2024 09:12:41 PM
- Form 4 - Statement of changes in beneficial ownership of securities • Edgar (US Regulatory) • 02/14/2024 10:15:55 PM
- Form 4 - Statement of changes in beneficial ownership of securities • Edgar (US Regulatory) • 02/14/2024 10:14:41 PM
- Form 4 - Statement of changes in beneficial ownership of securities • Edgar (US Regulatory) • 02/14/2024 10:13:33 PM
- Form 4 - Statement of changes in beneficial ownership of securities • Edgar (US Regulatory) • 02/14/2024 10:12:23 PM
- Form 4 - Statement of changes in beneficial ownership of securities • Edgar (US Regulatory) • 02/14/2024 10:08:19 PM
- Form SC 13G/A - Statement of acquisition of beneficial ownership by individuals: [Amend] • Edgar (US Regulatory) • 02/13/2024 10:02:40 PM
- Form 13F-HR - Quarterly report filed by institutional managers, Holdings • Edgar (US Regulatory) • 02/09/2024 10:14:24 PM
- Form 10-K - Annual report [Section 13 and 15(d), not S-K Item 405] • Edgar (US Regulatory) • 02/07/2024 11:52:35 AM
- Form 8-K - Current report • Edgar (US Regulatory) • 02/07/2024 11:33:20 AM
- CVS HEALTH REPORTS FOURTH QUARTER AND FULL-YEAR 2023 RESULTS • PR Newswire (US) • 02/07/2024 11:30:00 AM
Coinllectibles' Subsidiary, Grand Town Development Limited, Acquires Rare Song Dynasty Ceramics Worth Over USD28million • COSG • Apr 18, 2024 8:03 AM
ILUS Provides Form 10-K Filing Update • ILUS • Apr 17, 2024 9:54 AM
Glucotrack Announces Expansion of Its Continuous Glucose Monitoring Technology to Epidural Glucose Monitoring • GCTK • Apr 17, 2024 8:00 AM
Maybacks Global Entertainment To Fire Up 24 New Stations in Louisiana • AHRO • Apr 16, 2024 1:30 PM
Cannabix Technologies Begins Certification of Contactless Alcohol Breathalyzer, Re-Brands product series to Breath Logix • BLOZF • Apr 16, 2024 8:52 AM
Kona Gold Beverages, Inc. Acquires Surge Distribution LLC from Loud Beverage Group, Inc. (LBEV) • KGKG • Apr 16, 2024 8:30 AM

