


| Followers | 679 |
| Posts | 140823 |
| Boards Moderated | 36 |
| Alias Born | 03/10/2004 |
Friday, October 16, 2020 4:04:49 PM
By: Tim Ord | October 14, 2020
* (Click Read Full Story »»» at the bottom of the page for the charts to appear on the post)
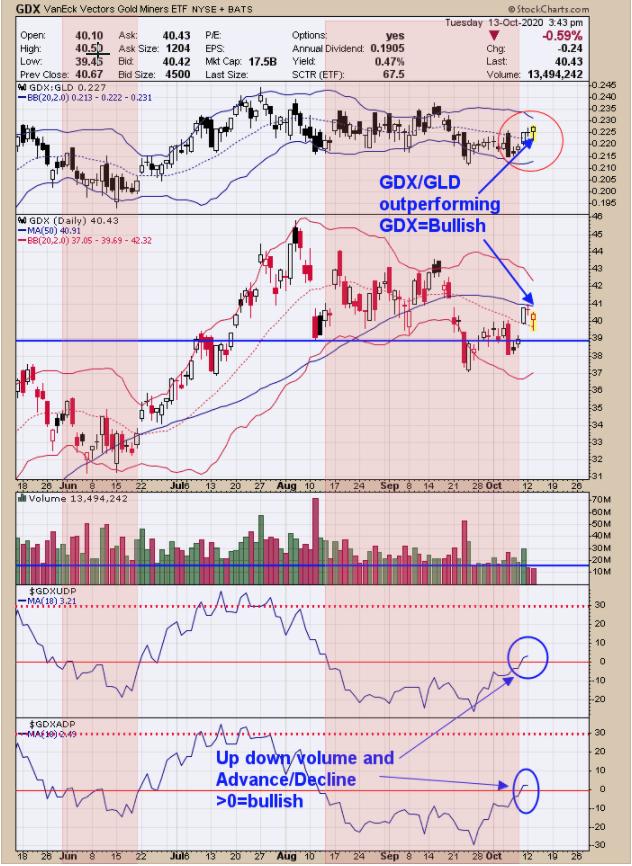
The bottom two windows are the 18 average of the Advance/Decline and 18 average of the Up Down Volume. When both are above "0" (which they are), that is a bullish sign for GDX (the pink-shaded area is when both are below "0", which is a bearish sign.). The next window up is the GDX/GLD ratio and a close above its mid Bollinger Band is a bullish sign. In bullish GDX moves, the GDX/GLD ratio outperforms and leads GDX. Today, GDX/GLD ratio closed above Friday's high, suggesting GDX will break above Friday's short-term. It appears the next impulse wave higher has started and new highs in GDX are possible. Long GDX on 10/9/20 at 40.78.
Tim Ord,
Editor
Read Full Story »»»
 DiscoverGold[/b
Information posted to this board is not meant to suggest any specific action, but to point out the technical signs that can help our readers make their own specific decisions. Caveat emptor!
• DiscoverGold
Recent GOLD News
- Barrick On Track to Achieve 2024 Targets • GlobeNewswire Inc. • 04/16/2024 11:00:00 AM
- Notice of Release of Barrick’s First Quarter 2024 Results • GlobeNewswire Inc. • 04/09/2024 11:00:00 AM
- Strategy-Driven Barrick Builds on Value Foundation • GlobeNewswire Inc. • 03/28/2024 09:20:38 PM
- Barrick Hunts New Gold and Copper Prospects in DRC From Kibali Base • GlobeNewswire Inc. • 03/20/2024 02:00:00 PM
- Barrick Opens Academy at Closed Buzwagi Mine • GlobeNewswire Inc. • 03/18/2024 08:00:00 AM
- Barrick to Grow Production and Value on Global Asset Foundation • GlobeNewswire Inc. • 03/15/2024 11:53:01 AM
- Loulo-Gounkoto Delivers Another Value-Creating Performance • GlobeNewswire Inc. • 03/10/2024 10:00:00 AM
- Passing of the Right Honorable Brian Mulroney • GlobeNewswire Inc. • 03/02/2024 01:17:35 AM
- Kibali and DRC Partner to Promote Local Content • GlobeNewswire Inc. • 03/01/2024 02:22:43 PM
- Tanzanian Parliamentary Committee Lauds Barrick’s Work at North Mara • GlobeNewswire Inc. • 02/23/2024 12:00:00 PM
- Form 6-K - Report of foreign issuer [Rules 13a-16 and 15d-16] • Edgar (US Regulatory) • 02/14/2024 10:28:08 PM
- Form 6-K - Report of foreign issuer [Rules 13a-16 and 15d-16] • Edgar (US Regulatory) • 02/14/2024 08:05:25 PM
- Clear Strategies and Strong Partnerships Set Barrick Up to Outperform, Says Bristow • GlobeNewswire Inc. • 02/14/2024 11:00:00 AM
- Barrick Announces New Share Buyback Program • GlobeNewswire Inc. • 02/14/2024 10:59:00 AM
- Barrick Declares Q4 Dividend • GlobeNewswire Inc. • 02/14/2024 10:58:00 AM
- NGM Strongly Positioned for Growth • GlobeNewswire Inc. • 02/10/2024 01:00:16 AM
- Form SC 13G - Statement of acquisition of beneficial ownership by individuals • Edgar (US Regulatory) • 02/08/2024 03:03:08 PM
- Form 6-K - Report of foreign issuer [Rules 13a-16 and 15d-16] • Edgar (US Regulatory) • 02/08/2024 12:46:55 PM
- Geologically Driven Asset Management Delivers Barrick’s Third Successive Year of Reserve Growth at Sustained Quality, While Unlocking Embedded Growth Portfolio • GlobeNewswire Inc. • 02/08/2024 12:00:00 PM
- Form SC 13G/A - Statement of acquisition of beneficial ownership by individuals: [Amend] • Edgar (US Regulatory) • 02/01/2024 06:04:56 PM
- Africa’s Largest Gold Mine Now Also One of Its Greenest • GlobeNewswire Inc. • 01/29/2024 04:00:00 PM
- Barrick Continues to be a Major Value Creator for Mali • GlobeNewswire Inc. • 01/27/2024 09:00:00 AM
- Barrick’s Lumwana Super Pit Project On Track for First Production in 2028 • GlobeNewswire Inc. • 01/23/2024 03:35:00 PM
- Barrick’s Tanzanian Mines on Tier One Track With Potential for Extending Lives, Growing Production • GlobeNewswire Inc. • 01/21/2024 12:00:00 PM
- New Airport Terminal at Kahama Airstrip to Leave Lasting Legacy at Barrick’s Buzwagi Gold Mine • GlobeNewswire Inc. • 01/21/2024 08:00:00 AM
Kona Gold Beverages, Inc. Announces Name Change to NuVibe, Inc. and Initiation of Ticker Symbol Application Process • KGKG • Apr 25, 2024 8:30 AM
Axis Technologies Group and Carbonis Forge Ahead with New Digital Carbon Credit Technology • AXTG • Apr 24, 2024 3:00 AM
North Bay Resources Announces Successful Equipment Test at Bishop Gold Mill, Inyo County, California • NBRI • Apr 23, 2024 9:41 AM
Epazz, Inc.: CryObo, Inc. solar Bitcoin operations will issue tokens • EPAZ • Apr 23, 2024 9:20 AM
Avant Technologies Launches Advanced AI Supercomputing Network and Expansive Data Solutions • AVAI • Apr 23, 2024 8:00 AM
BestGrowthStocks.com Issues Comprehensive Analysis of Triller Merger with AGBA Group Holding Limited • AGBA • Apr 22, 2024 1:00 PM

