


| Followers | 679 |
| Posts | 140763 |
| Boards Moderated | 36 |
| Alias Born | 03/10/2004 |
Sunday, November 10, 2019 8:19:25 AM
By: Carl Swenlin | November 8, 2019
* (Click Read Full Story »»» at the bottom of the page for the charts to appear on the post)
GOLD
IT Trend Model: NEUTRAL as of 11/8/2019
LT Trend Model: BUY as of 1/8/2019
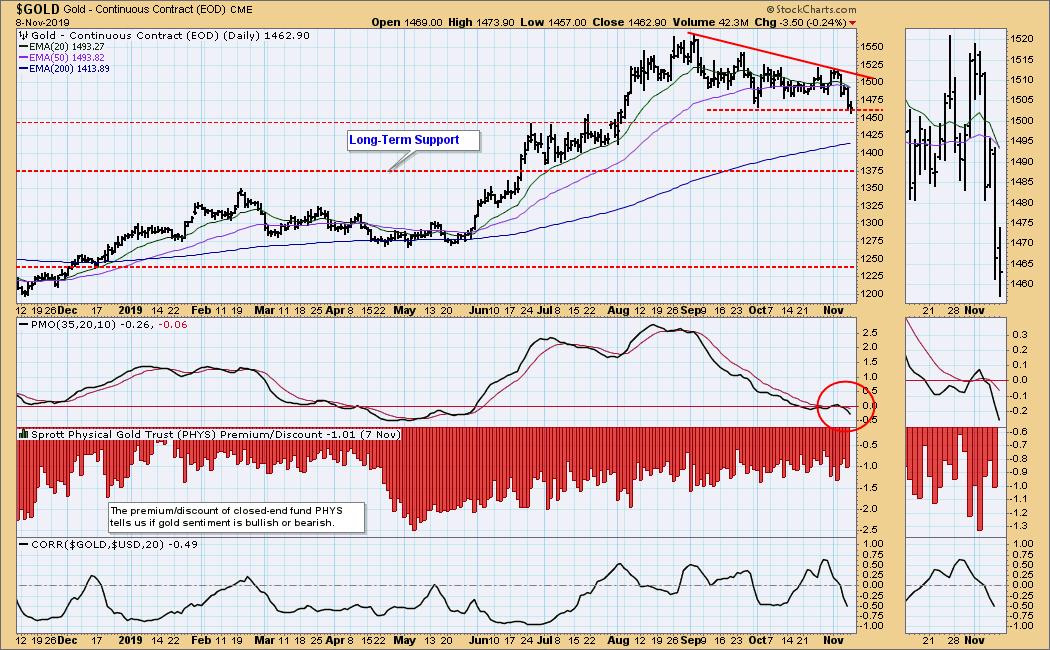
GOLD Daily Chart: On Friday the 20EMA crossed down through the 50EMA, changing the IT Trend Model signal from BUY to NEUTRAL. Gold has encountered the line of support drawn across the October low. If that doesn't hold there is another support line, which begins at the top of the area of congestion that formed in June and July. The most important support is at 1375, the origin of which will be seen on the weekly chart.
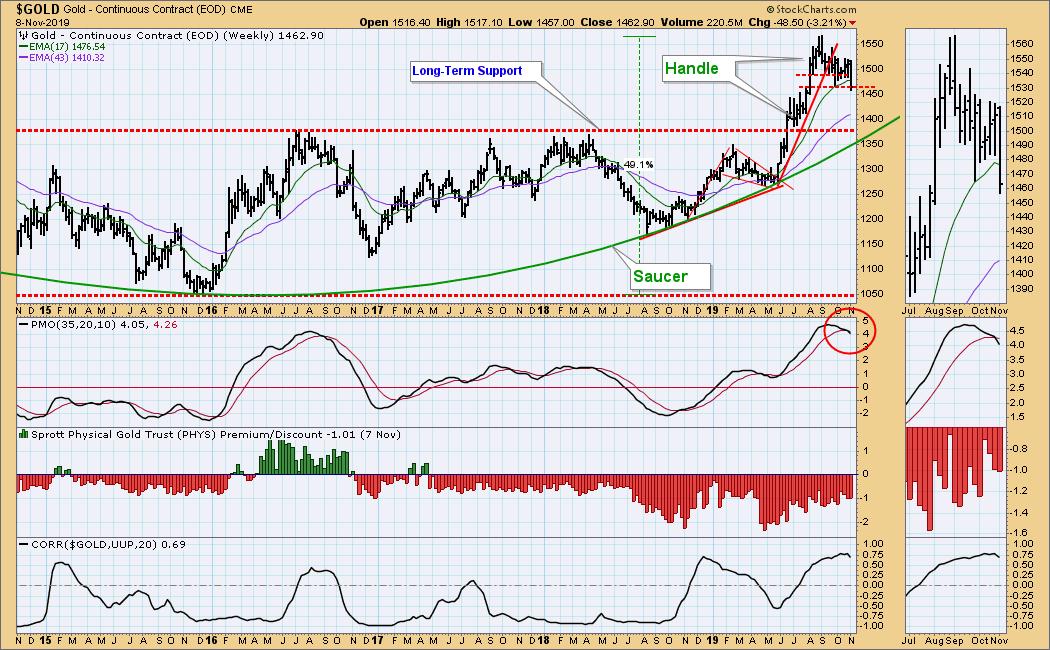
GOLD Weekly Chart: Part of a bullish saucer with handle formation can be seen in this time frame. On the bearish side, the weekly PMO has topped in overbought territory.
Read Full Story »»»
 DiscoverGold
Information posted to this board is not meant to suggest any specific action, but to point out the technical signs that can help our readers make their own specific decisions. Your Due Dilegence is a must!
• DiscoverGold
Recent GDX News
- YieldMax GDXY Name Change • GlobeNewswire Inc. • 01/25/2024 04:22:00 PM
- Surging S&P 500 Breadth • ValueWalk • 07/19/2023 03:16:37 PM
- S&P 500 Corrects In Breadth • ValueWalk • 07/18/2023 03:08:49 PM
- If The USDX Fell So Much, Why Didn’t Gold Truly Soar? • ValueWalk • 07/17/2023 05:16:20 PM
- USD’s Decline That’s… Bearish For Gold?! • ValueWalk • 07/12/2023 02:38:08 PM
- S&P 500 Late Day Reversal Worry • ValueWalk • 07/10/2023 03:17:34 PM
- Massive Gaming Celebrates Global Launch of House of Blackjack with USDC Earning Race • ValueWalk • 07/10/2023 02:44:17 PM
- Breathers In Mining Stocks Are Not Real Rallies • ValueWalk • 07/06/2023 05:20:55 PM
- S&P 500 Character Changes • ValueWalk • 07/06/2023 03:10:06 PM
- S&P 500 – As Bullish As It Gets • ValueWalk • 07/03/2023 04:01:21 PM
- The Great Gold Migration: How Asia Is Dominating The Global Gold Landscape • ValueWalk • 06/30/2023 05:07:35 PM
- S&P 500 Dip Buying And Tame PCE • ValueWalk • 06/30/2023 03:34:13 PM
- The Bullish Reversal In Gold Is Coming • ValueWalk • 06/29/2023 04:00:44 PM
- Insufficient S&P 500 Rotations • ValueWalk • 06/27/2023 02:41:42 PM
- Failing S&P 500 Rotations • ValueWalk • 06/23/2023 03:09:19 PM
- Countdown to S&P 500 Downleg • ValueWalk • 06/19/2023 01:49:20 PM
- Now THAT Was The Game-Changer For The Price Of Gold! • ValueWalk • 06/15/2023 04:40:35 PM
- S&P 500 Manages To Recover Initial Decline • ValueWalk • 06/15/2023 03:30:07 PM
- S&P 500 Manages To Recover From Tech-Driven Decline • ValueWalk • 06/15/2023 03:30:07 PM
- S&P 500 Withstands The Initial Selling – No Hike Tomorrow • ValueWalk • 06/13/2023 03:15:19 PM
- Roadmap For Mining Stocks – Courtesy Of The Stock Market • ValueWalk • 06/06/2023 03:17:49 PM
- Stocks To Still Extend S&P 500 Upswing • ValueWalk • 06/05/2023 03:31:02 PM
- AI, Stocks, And Gold Stocks – Connected After All • ValueWalk • 05/31/2023 03:29:15 PM
- Could Gold Miners Finally Stop Sliding?! • ValueWalk • 05/26/2023 08:42:37 PM
- S&P 500 Fine Selling Initiative • ValueWalk • 05/24/2023 03:06:00 PM
FEATURED Cannabix Technologies to Present Marijuana Breathalyzer Technology at International Association for Chemical Testing (IACT) Conference in California • Apr 22, 2024 8:49 AM
BestGrowthStocks.com Issues Comprehensive Analysis of Triller Merger with AGBA Group Holding Limited • AGBA • Apr 22, 2024 1:00 PM
Kona Gold Beverages, Inc. Prepares for First Production Run Set to Launch May 17, 2024 • KGKG • Apr 22, 2024 8:30 AM
VPR Brands LP Reports Record Annual Financial Performance for Fiscal Year 2023 • VPRB • Apr 19, 2024 11:24 AM
Coinllectibles' Subsidiary, Grand Town Development Limited, Acquires Rare Song Dynasty Ceramics Worth Over USD28million • COSG • Apr 18, 2024 8:03 AM
ILUS Provides Form 10-K Filing Update • ILUS • Apr 17, 2024 9:54 AM

