S&P 500 Pauses to Refresh By: Tushar Chande | December 7, 2017
Topics: Market consolidates under all time high; guessing support for $SPX; gold breaks down; semiconductors find support; dollar forms higher low, looks stronger technically. A big thank you to Tom and Erin for inviting me to their Market Watchers Live show (on 12/06/17) and to all their listeners who tuned in and responded with questions and comments. There are some references for you below (that connect to the discussion on the show).
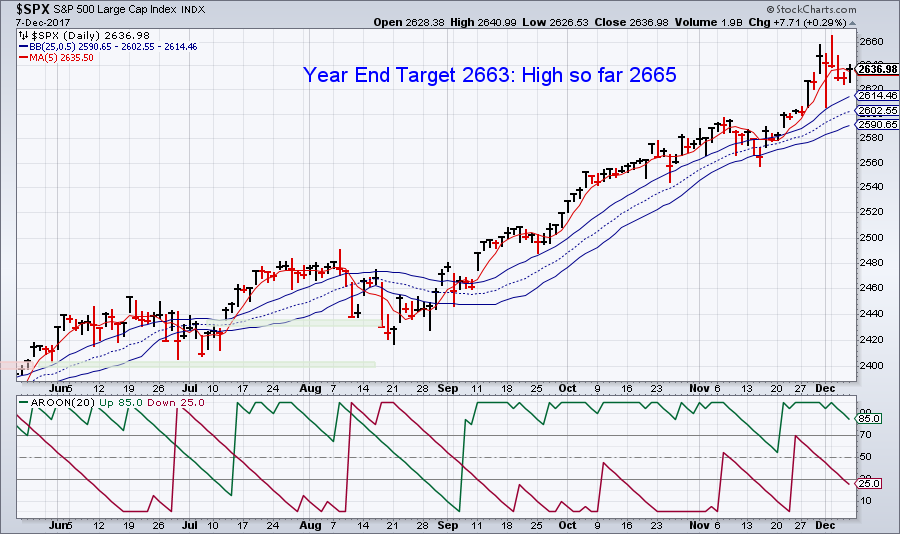
Chart 1: The year-end forecast can be found here and here.
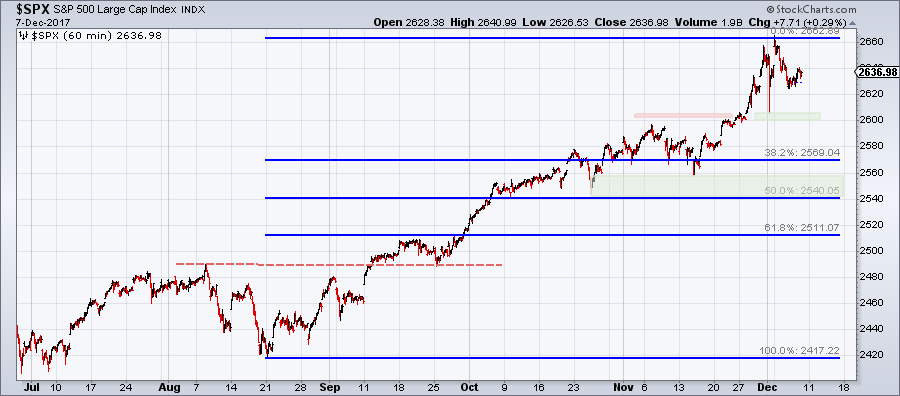
The market continues to consolidate just below all-time highs. My year-end target was $SPX of 2663, and so far the high in the $SPX is a bit over 2665. One can draw some support under recent lows that also find resonance in Fibonacci retracement levels. The 60-minute $SPX chart shows the breakout, retest and subsequent rally. Initial support starts at 2600, spike low from a few days ago. A bit stronger support appears starting at 2540, and is in the middle of the Fibonacci retracement ranges.
Chart 2: Here are some guesses for potential areas of support (should they be needed). The first ledge of support is at 2600.
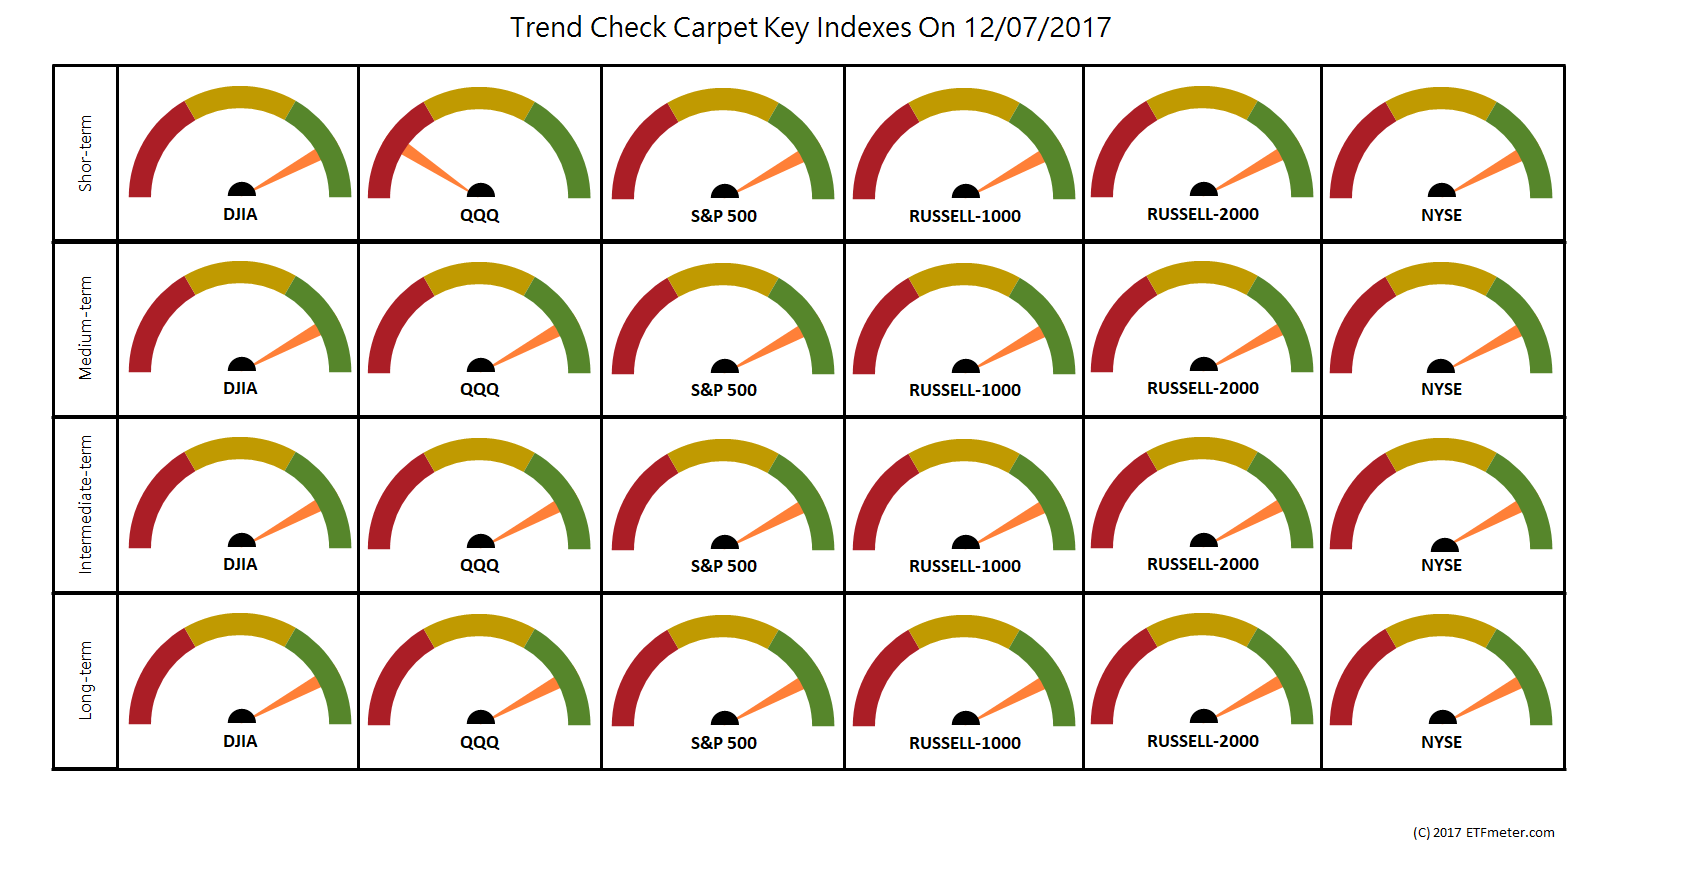
Trend Check Carpets
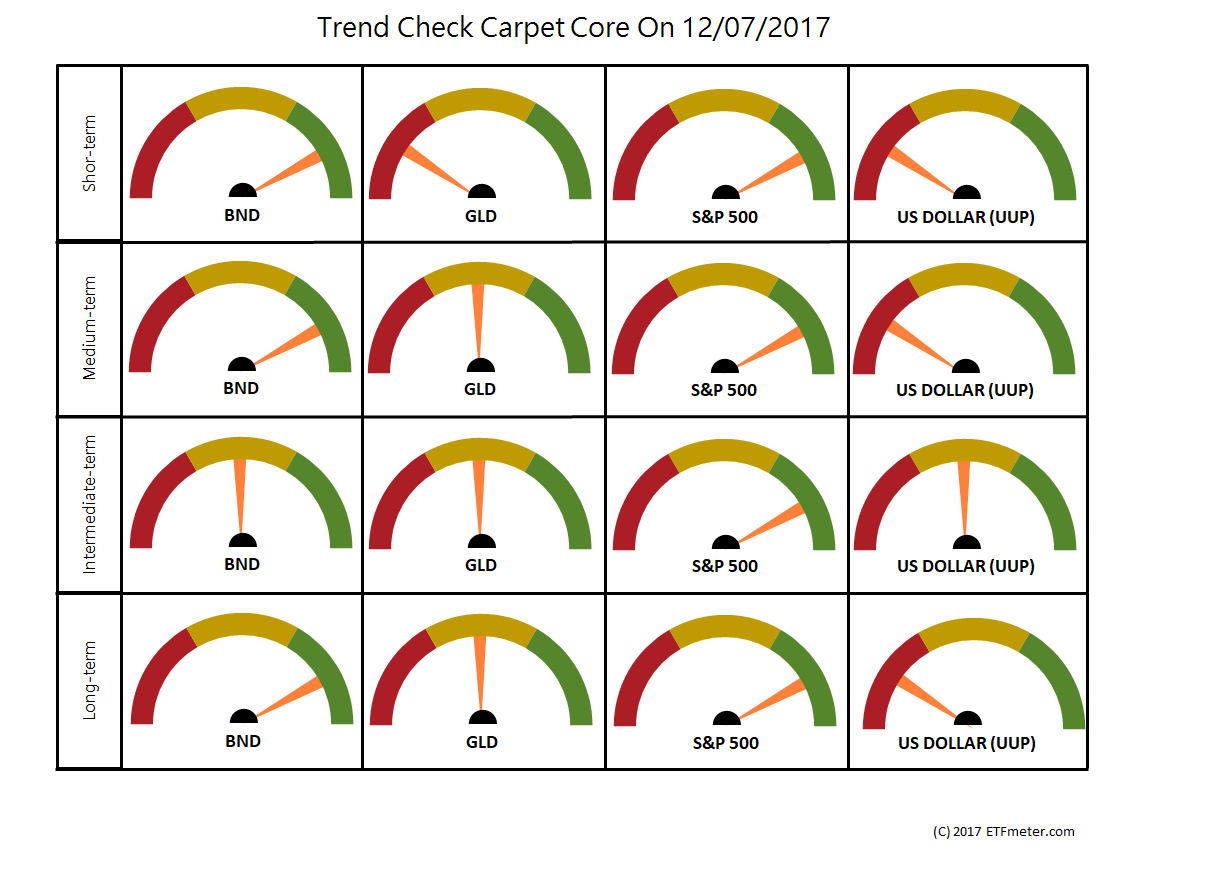
The rotation out of technology stocks has turned the short-term trend bearish in the QQQ. All other indexes and time frames are bullish. The trend check carpet for the four core areas of bonds, gold, equities and dollar shows a mixed picture. Gold is breaking down in the short term and is flat in all other time frames. Bonds are generally bullish except for the intermediate term. The dollar is mostly bearish except for the intermediate term.
Chart 3: The time-frame starts at 25 days and doubles at each step from top to bottom all the way to 200 days. The number of stocks in each index increases from left to right. Other than the QQQ over the short term, the rest of the market action is bullish. The models used in the analysis are here.
Chart 4: Focusing on just bonds, gold, equities and the dollar, the breakdown in gold in the short-term stands out. Bonds and equities are mostly bullish, and dollar is mixed.
Gold Breaks Down
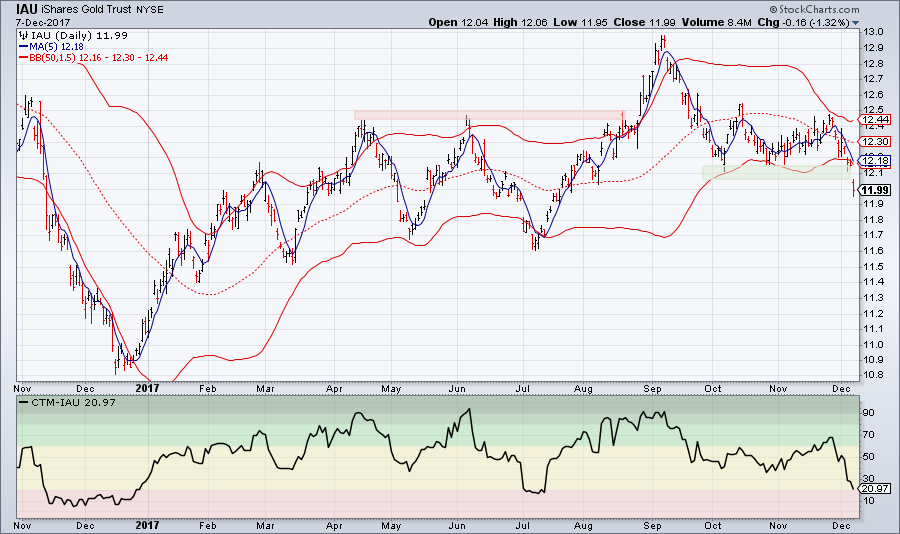
As we saw in Chart 4, gold is breaking down in the short term. A daily chart of the iShares IAU Gold trust shows the recent drop below support and trip outside the 50-day, 1.5-sigma Bollinger bands that have contained price action. The chart looks similar the breakdown at the left edge of the chart.
Chart 5: Gold has broken down in a serious way here, and looks as bearish as it looked last November.
Dollar Index Forms a Higher Near-term Low
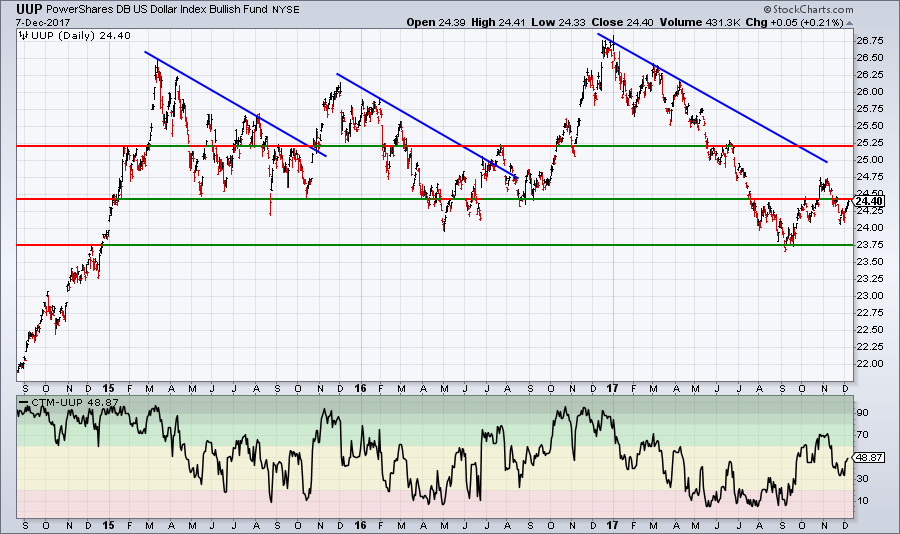
The long-term picture of the dollar index shows that it seems to have made a higher low after making a higher high, following support at 23.75 or so in September (See chart 6). A closer look at the recent price action is in Chart 7.
Chart 6: The UUP ETF is clearly trying to form a bottom here after forming a higher low following a higher high.
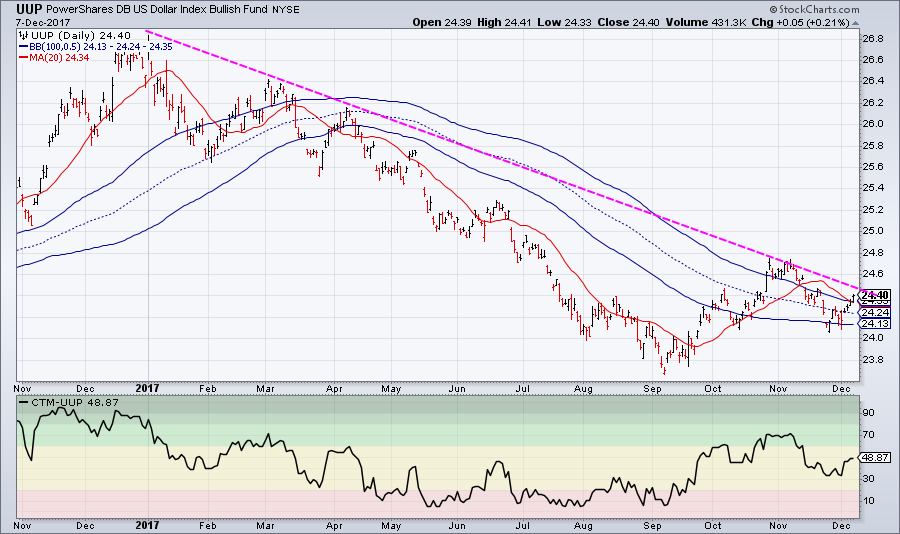
Chart 7: A closer look at the recent price action of the dollar index suggests it may be getting ready to break out over the pink down-trend line. Note how the CTM stayed in the pink or yellow areas throughout the downtrend.
Short-term View of the $SOX Index
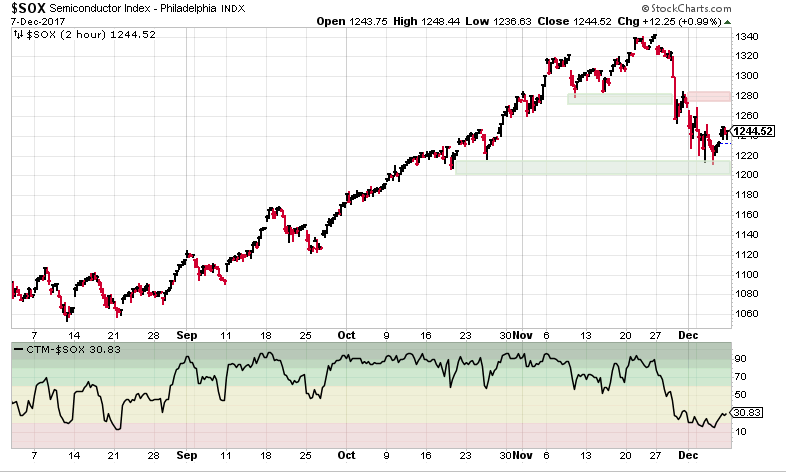
The recent selling in the market was focused in the semiconductor index, represented here by the $SOX index. A two-hour chart of the $SOX index shows that it broke support at 1280, which now becomes resistance for the bounce off the 1200-1220 area. The Chande Trend Meter shows what happened in the previous consolidation at the left of the chart. A basing period will be needed after the strong selling over the past few days. The next up-move will be signaled when the Chande Trend Meter rises above 70 on the chart.
Chart 8: A 2-hour chart of the $SOX index shows key resistance in the 1280 area, as the index finds support in the 1200-1220 area. The next up move will push the CTM above 70.
Looking Ahead
The head-line risk we have pointed to for the past two months arrived in the form of insider trades based on knowledge of what was in the tax reform legislation in the upper chamber. The adjustment was rapid and violent, as one must expect when the smart money turns on a dime. More headlines lurk, but the market is trying to stabilize here for now.
Information posted to this board is not meant to suggest any specific action, but to point out the technical signs that can help our readers make their own specific decisions. Your Due Dilegence is a must! • DiscoverGold
Register for free to join our community of investors and share your ideas. You will also get access to streaming quotes, interactive charts, trades, portfolio, live options flow and more tools.


 News
News  Market Data
  Discover