


| Followers | 679 |
| Posts | 140763 |
| Boards Moderated | 36 |
| Alias Born | 03/10/2004 |
Tuesday, October 24, 2017 1:07:25 PM
By: Clive Maund | October 23, 2017
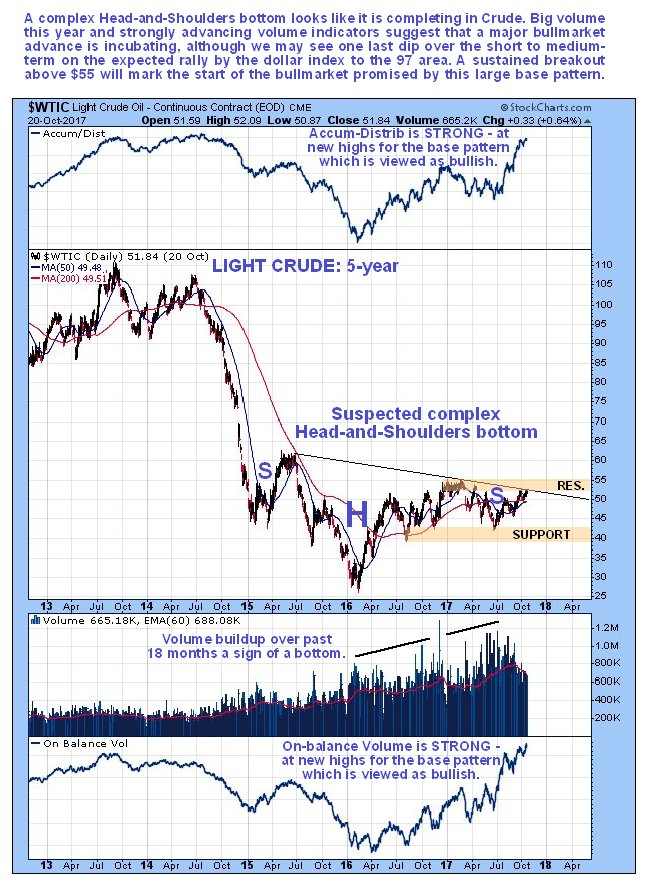
Generally the oil charts look very positive with a giant base pattern approaching completion. Near-term we may see a minor dip on the expected dollar rally.
On the 5-year chart for Light Crude we can see that a giant complex Head-and-Shoulders bottom pattern has formed which looks very close to being completed. It is labeled complex because the right part of it is drawn out with multiple “Shoulders”. An important bullish factor that strongly suggests that the base pattern is genuine and will resolve into a major bullmarket is the big buildup in volume over the past 2 years, in particular this year, especially because most of this is upside volume which has driven both volume indicators shown much higher, with the Accum-Distrib line close to new highs, and On-balance Volume at new highs. Breakout from the entire base pattern will be signaled by the price breaking above the resistance level related to the tight congestion zone that formed early in the year, i.e. by the price breaking above $55. It is close to achieving this, and while we can’t rule out that it will happen very soon, it is thought more likely that we will see a mild reaction as the dollar advances towards its target in the 97 area, and THEN oil turns up and breaks out of the base pattern.
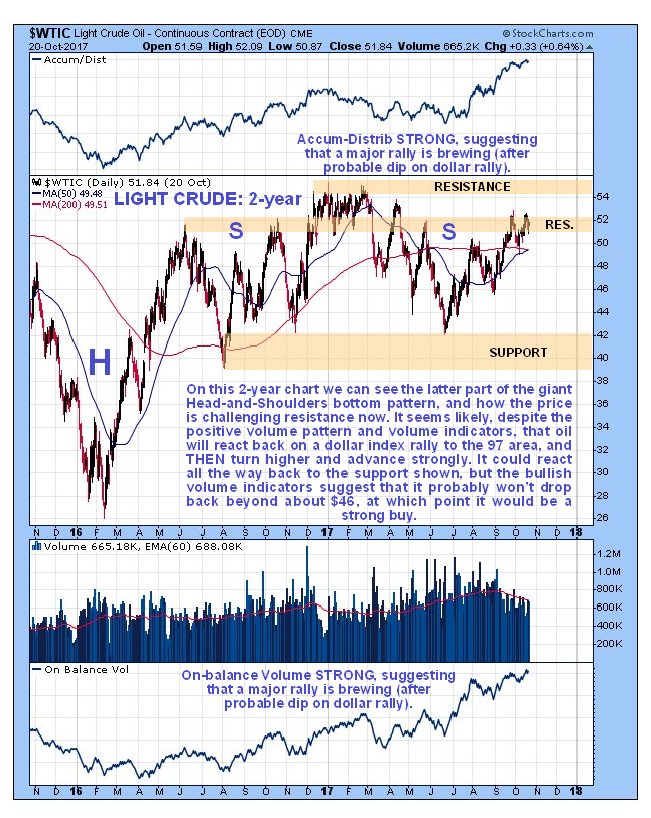
The 2-year chart for Light Crude shows the latter part of the giant Head-and-Shoulders bottom pattern. On this chart we can see how the price has been challenging the resistance up towards the top of the pattern in recent weeks. Before breaking out above the key $55 level, it is considered likely that it will first react back over the short to medium-term on the expected dollar rally. However, because of the strong volume pattern and volume indicators it is considered unlikely that it will back all the way to the support level shown in the $39 - $42. Instead it is thought likely that it turn up again at a higher level, say from the $46 area where there is some support. Once evidence is seen of it stabilizing in this area and turning higher, oil and oil related investments will quickly become strong buys.
The Crude Oil Hedgers chart shown below is quite bearish, although not at wild extremes…
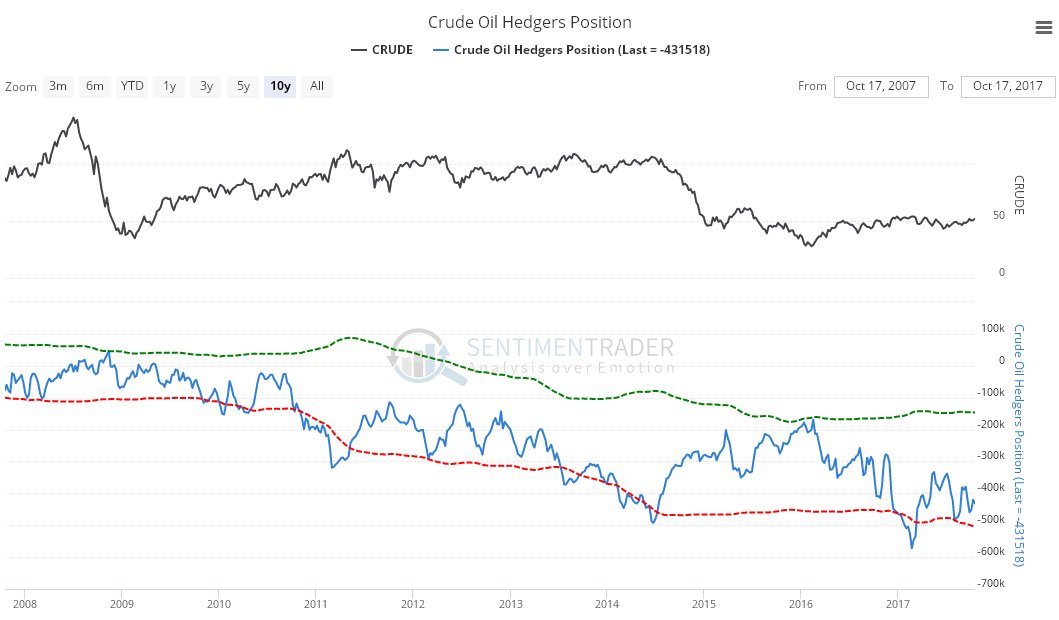
Chart courtesy of www.sentimentrader.com
The Crude Oil optix or optimism index is likewise quite bearish, although it too is not at wild extremes, but both this and the Hedgers chart suggest that oil is more likely to drop over the short to medium-term than rally, which fits with what the other technical factors observed above are pointing to.
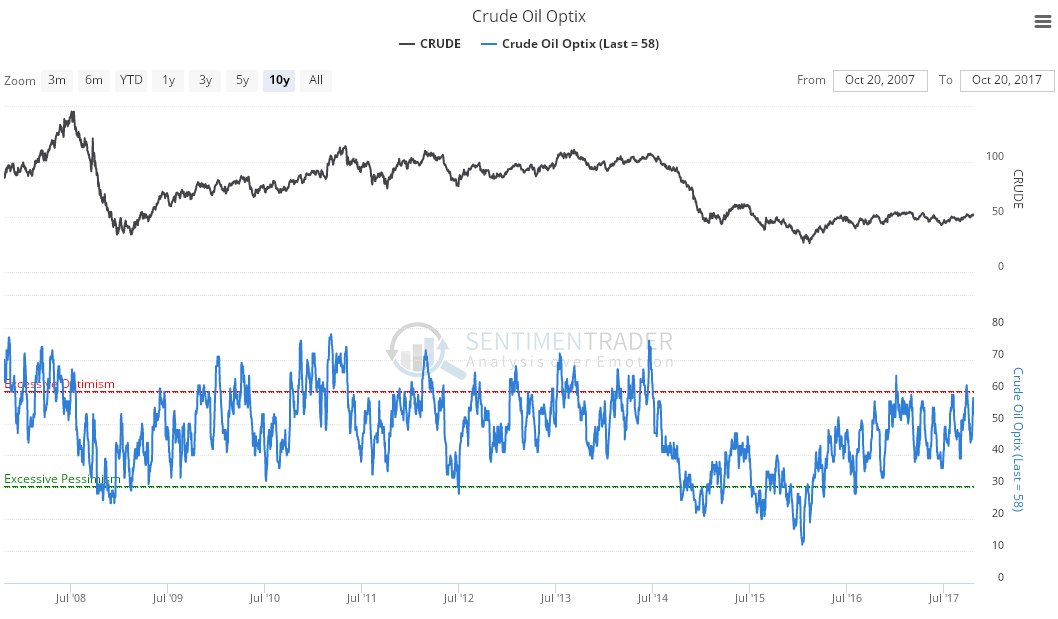
Chart courtesy of www.sentimentrader.com
It is thus interesting to observe, in addition, that we are now entering the most bearish time of year seasonally for oil, although this of course is a background influence that can be overridden by other factors…
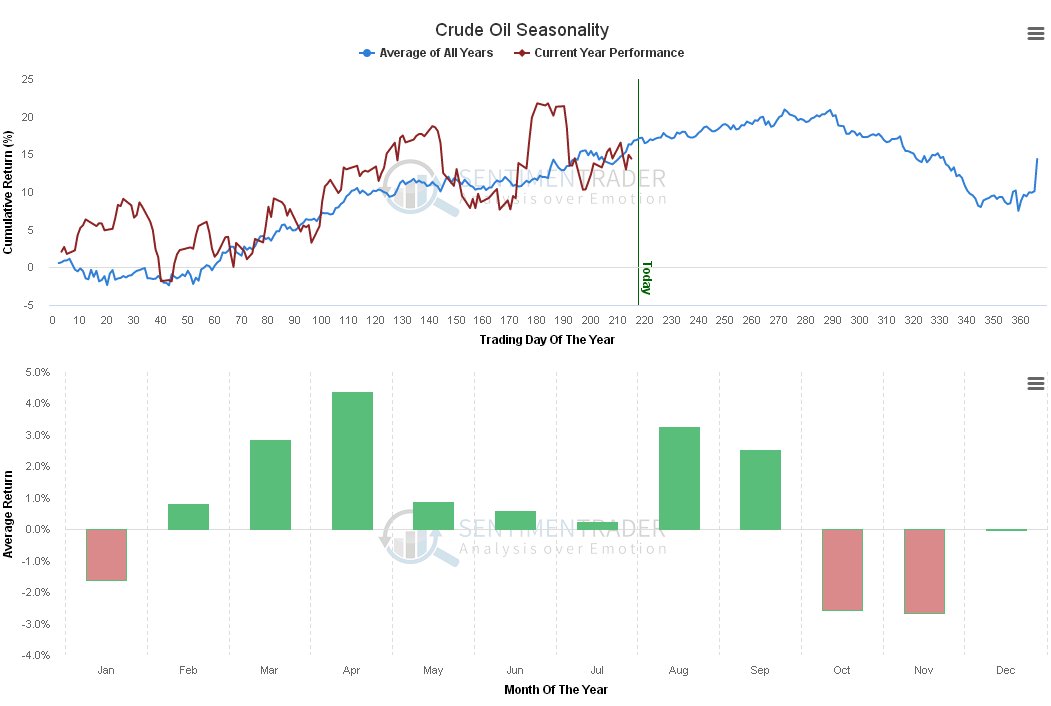
Chart courtesy of www.sentimentrader.com
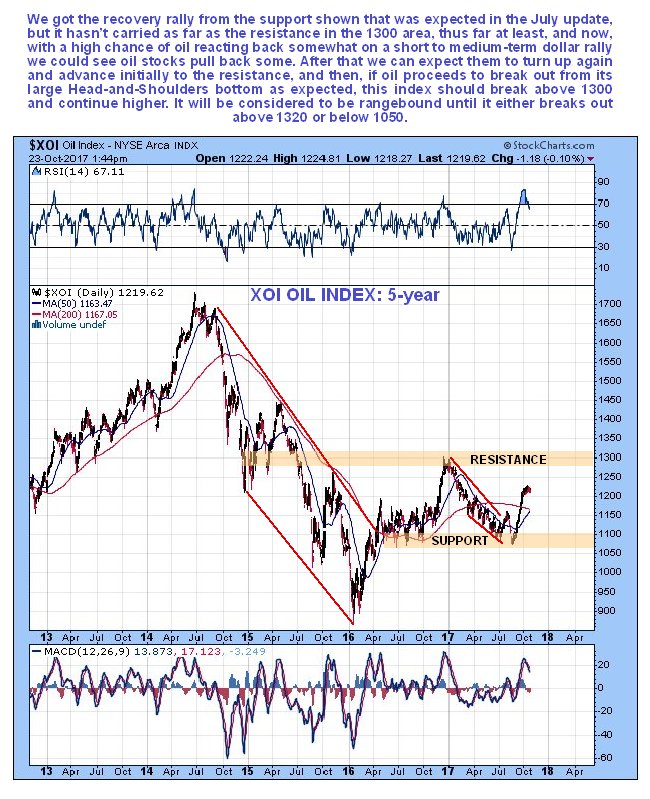
Turning now to oil stocks, we see on the 5-year chart for the XOI oil index how it turned higher as predicted in the July update and has staged a significant rally. We thought that it might get as high as the resistance in the 1300 area on this run, but now it looks like it will first react back before continuing on to the 1300 area, due to a minor reaction back by oil over the short to medium-term as the dollar advances to its target. Once Light Crude itself breaks out of its Head-and-Shoulders bottom by breaking above the key $55 level, then of course the XOI oil index should vault above the resistance in the 1300 area, which would break it out of the large trading range it has been stuck in for about 18 months, bounded by approximately 1070 on the downside and 1300 on the upside.
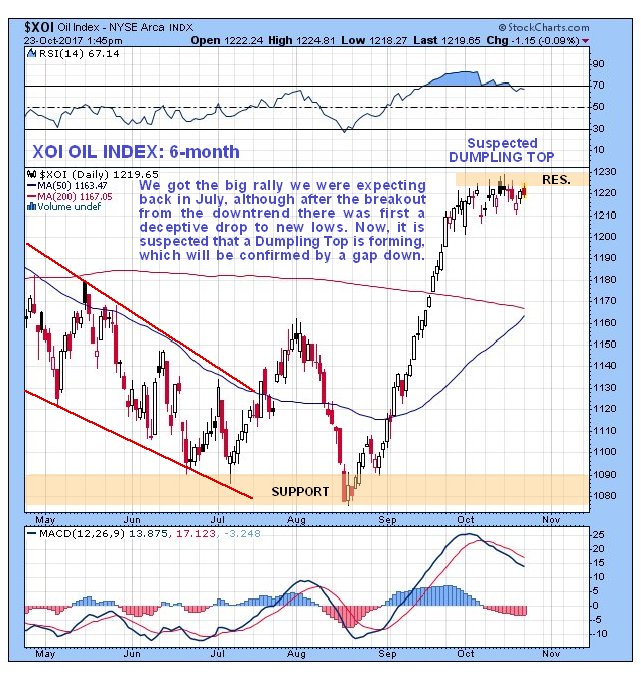
On the latest 6-month chart for the XOI oil index we can see how the July breakout out of the downtrend in force from the start of the year was followed by a deceptive drop to new lows, before a steep orderly uptrend followed that ran out of steam at the end of last month, with the price then rounding over into what is suspected to be a “Dumpling Top”. This suspected intermediate top pattern will be confirmed by a gap down move on the right of it to complete it, which should occur as a result of oil dropping back some in response to the dollar rallying.
https://www.clivemaund.com/free.php?id=69
• DiscoverGold
Click on "In reply to", for Authors past commentaries
****************************************
*** For Market Direction and Trends visit our board:
https://investorshub.advfn.com/Market-Direction-and-Trends-26249/
Information posted to this board is not meant to suggest any specific action, but to point out the technical signs that can help our readers make their own specific decisions. Your Due Dilegence is a must!
• DiscoverGold
FEATURED Cannabix Technologies to Present Marijuana Breathalyzer Technology at International Association for Chemical Testing (IACT) Conference in California • Apr 22, 2024 8:49 AM
BestGrowthStocks.com Issues Comprehensive Analysis of Triller Merger with AGBA Group Holding Limited • AGBA • Apr 22, 2024 1:00 PM
Kona Gold Beverages, Inc. Prepares for First Production Run Set to Launch May 17, 2024 • KGKG • Apr 22, 2024 8:30 AM
VPR Brands LP Reports Record Annual Financial Performance for Fiscal Year 2023 • VPRB • Apr 19, 2024 11:24 AM
Coinllectibles' Subsidiary, Grand Town Development Limited, Acquires Rare Song Dynasty Ceramics Worth Over USD28million • COSG • Apr 18, 2024 8:03 AM
ILUS Provides Form 10-K Filing Update • ILUS • Apr 17, 2024 9:54 AM

