


| Followers | 679 |
| Posts | 140795 |
| Boards Moderated | 36 |
| Alias Born | 03/10/2004 |
Sunday, October 08, 2017 10:36:33 PM
By: Clive Maund | October 8, 2017
The last Silver Market update almost a month ago called the intermediate top within a day, as you may recall, and it has back to the extent predicted in that update.
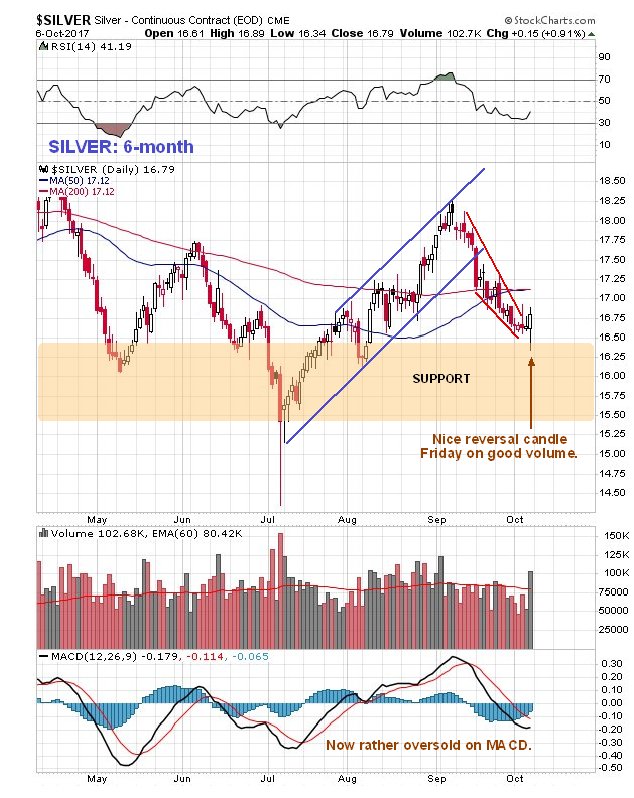
There was more evidence of a turn in silver than gold on Friday, when a more obvious reversal candle appeared on its chart. On the 6-month chart we can see that a long-tailed candle occurred that approximates to a bull hammer where the price closed not far off the day’s highs on the biggest volume for over a month. After its recent reaction this certainly looks like a reversal, especially as the downtrend channel has been converging. The earlier overbought condition has more than fully unwound and the price has dropped back into a zone of support.
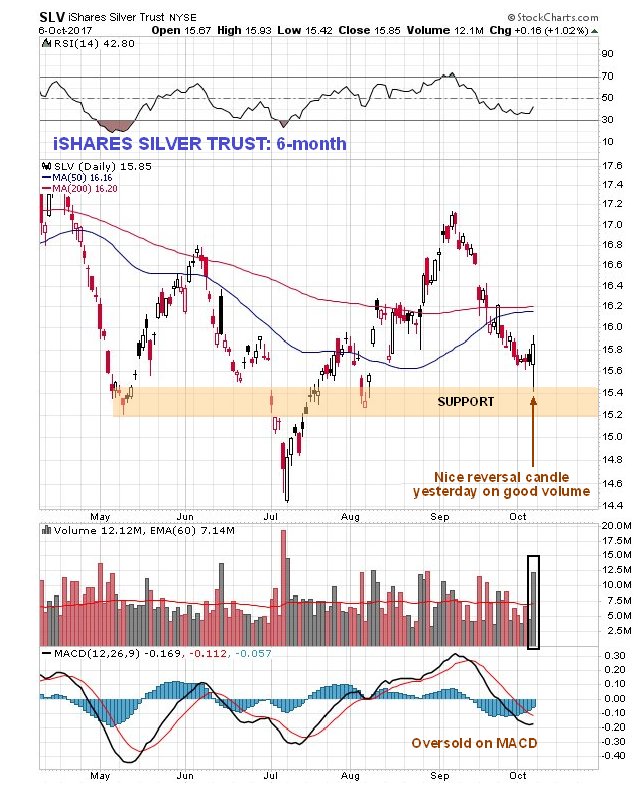
There was an even more pronounced reversal candle on Friday in silver proxy iShares Silver Trust…
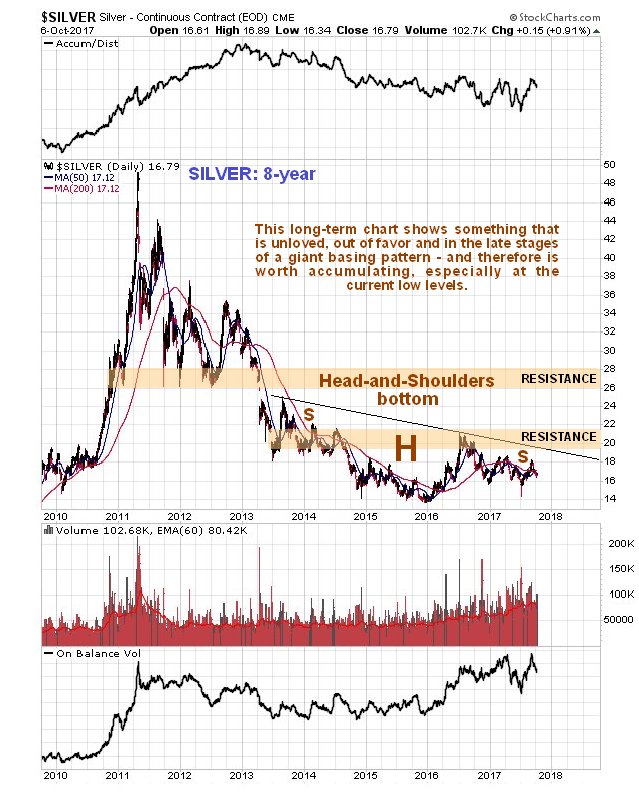
Like gold, silver is marking out a giant Head-and-Shoulders bottom pattern, but in silver’s case it is downsloping as we can see on its 8-year chart below, which reflects the fact that silver tends to underperform gold at the end of sector bearmarkets and during the early stages of sector bullmarkets. Prolonged underperformance by silver is therefore a sign of a bottom. This chart really does show how unloved silver is right now, but although the price has drifted slightly lower over the past several years, volume indicators have improved, especially this year, a positive sign. A break above the neckline of the pattern, the black line, will be a positive development, and more so a break above the band of resistance approaching the 2016 highs. Once it gets above this it will have to contend with a quite strong zone of resistance roughly between $26 and $28. Silver is amongst the most unloved of all metals, a situation that is not expected to continue, partly because silverbugs are manic-depressive and they have been depressive for a long time, meaning that it surely won’t be all that long until they are on the rooftops singing Happy Days are Here Again.
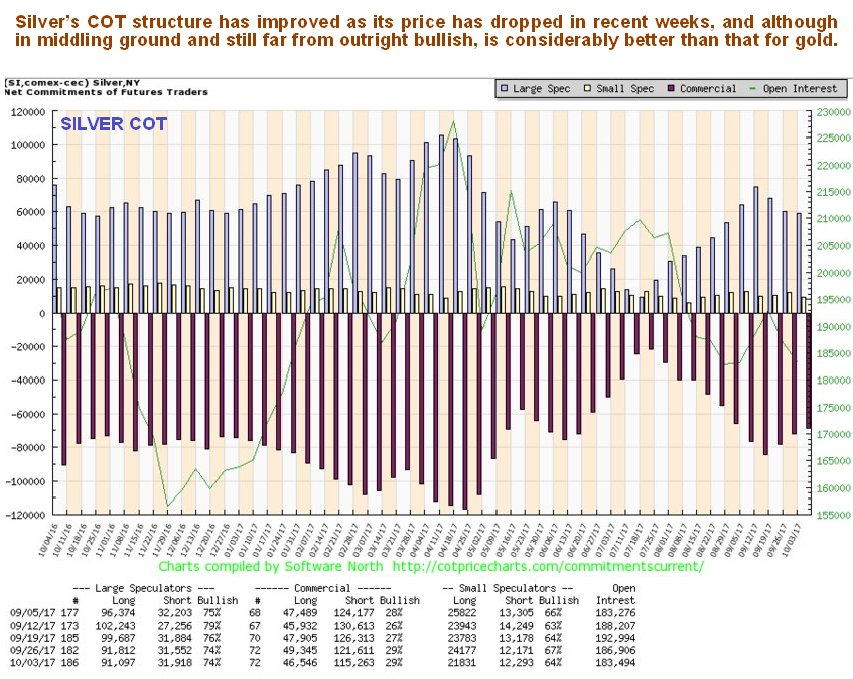
As with gold, silver’s COT structure has improved in recent weeks as the price has dropped, and although readings are still far from levels that can be described as outright bullish, they are considerably better than those for gold, which could be a sign that silver is set to outperform gold at last…
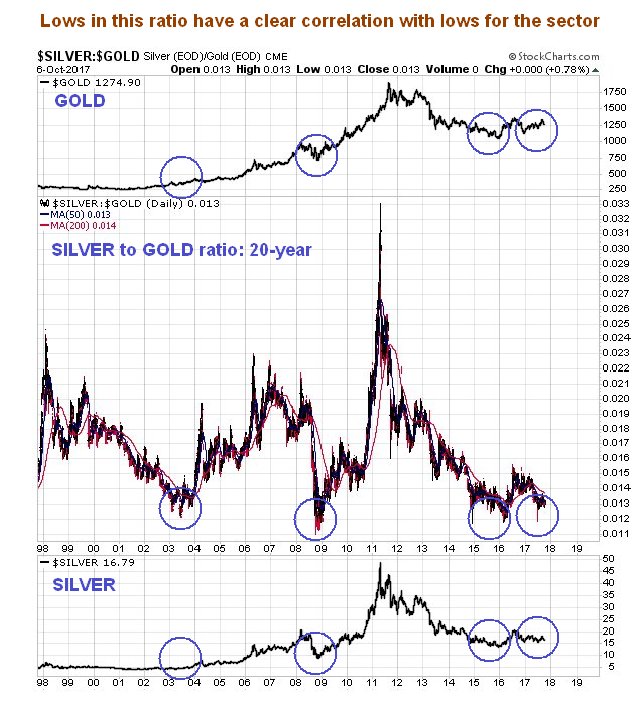
Extreme lows in the silver / gold ratio are reliable indicators of either a sector bottom or they can occur during the early stages of a sector bullmarket, as can be seen on the long-term silver over gold chart shown below, which goes back to late 1997. When a low in this ratio occurred in 2003, the sector was already in a bullmarket, but as we can see, it had much further to run. The next major low followed the 2008 market crash. More recently the ratio plumbed very low levels again at the end of 2014 and early in 2016, which marked the sector bottom after the brutal bearmarket from the 2011 highs. Right now it is only a whisker above these lows, which is a strong sign that another bullmarket is just around the corner.
https://www.clivemaund.com/free.php?id=67
• DiscoverGold
Click on "In reply to", for Authors past commentaries
*** For Market Direction and Trends visit our board:
https://investorshub.advfn.com/Market-Direction-and-Trends-26249/
Information posted to this board is not meant to suggest any specific action, but to point out the technical signs that can help our readers make their own specific decisions. Your Due Dilegence is a must!
• DiscoverGold
Recent GOLD News
- Barrick On Track to Achieve 2024 Targets • GlobeNewswire Inc. • 04/16/2024 11:00:00 AM
- Notice of Release of Barrick’s First Quarter 2024 Results • GlobeNewswire Inc. • 04/09/2024 11:00:00 AM
- Strategy-Driven Barrick Builds on Value Foundation • GlobeNewswire Inc. • 03/28/2024 09:20:38 PM
- Barrick Hunts New Gold and Copper Prospects in DRC From Kibali Base • GlobeNewswire Inc. • 03/20/2024 02:00:00 PM
- Barrick Opens Academy at Closed Buzwagi Mine • GlobeNewswire Inc. • 03/18/2024 08:00:00 AM
- Barrick to Grow Production and Value on Global Asset Foundation • GlobeNewswire Inc. • 03/15/2024 11:53:01 AM
- Loulo-Gounkoto Delivers Another Value-Creating Performance • GlobeNewswire Inc. • 03/10/2024 10:00:00 AM
- Passing of the Right Honorable Brian Mulroney • GlobeNewswire Inc. • 03/02/2024 01:17:35 AM
- Kibali and DRC Partner to Promote Local Content • GlobeNewswire Inc. • 03/01/2024 02:22:43 PM
- Tanzanian Parliamentary Committee Lauds Barrick’s Work at North Mara • GlobeNewswire Inc. • 02/23/2024 12:00:00 PM
- Form 6-K - Report of foreign issuer [Rules 13a-16 and 15d-16] • Edgar (US Regulatory) • 02/14/2024 10:28:08 PM
- Form 6-K - Report of foreign issuer [Rules 13a-16 and 15d-16] • Edgar (US Regulatory) • 02/14/2024 08:05:25 PM
- Clear Strategies and Strong Partnerships Set Barrick Up to Outperform, Says Bristow • GlobeNewswire Inc. • 02/14/2024 11:00:00 AM
- Barrick Announces New Share Buyback Program • GlobeNewswire Inc. • 02/14/2024 10:59:00 AM
- Barrick Declares Q4 Dividend • GlobeNewswire Inc. • 02/14/2024 10:58:00 AM
- NGM Strongly Positioned for Growth • GlobeNewswire Inc. • 02/10/2024 01:00:16 AM
- Form SC 13G - Statement of acquisition of beneficial ownership by individuals • Edgar (US Regulatory) • 02/08/2024 03:03:08 PM
- Form 6-K - Report of foreign issuer [Rules 13a-16 and 15d-16] • Edgar (US Regulatory) • 02/08/2024 12:46:55 PM
- Geologically Driven Asset Management Delivers Barrick’s Third Successive Year of Reserve Growth at Sustained Quality, While Unlocking Embedded Growth Portfolio • GlobeNewswire Inc. • 02/08/2024 12:00:00 PM
- Form SC 13G/A - Statement of acquisition of beneficial ownership by individuals: [Amend] • Edgar (US Regulatory) • 02/01/2024 06:04:56 PM
- Africa’s Largest Gold Mine Now Also One of Its Greenest • GlobeNewswire Inc. • 01/29/2024 04:00:00 PM
- Barrick Continues to be a Major Value Creator for Mali • GlobeNewswire Inc. • 01/27/2024 09:00:00 AM
- Barrick’s Lumwana Super Pit Project On Track for First Production in 2028 • GlobeNewswire Inc. • 01/23/2024 03:35:00 PM
- Barrick’s Tanzanian Mines on Tier One Track With Potential for Extending Lives, Growing Production • GlobeNewswire Inc. • 01/21/2024 12:00:00 PM
- New Airport Terminal at Kahama Airstrip to Leave Lasting Legacy at Barrick’s Buzwagi Gold Mine • GlobeNewswire Inc. • 01/21/2024 08:00:00 AM
Axis Technologies Group and Carbonis Forge Ahead with New Digital Carbon Credit Technology • AXTG • Apr 24, 2024 3:00 AM
North Bay Resources Announces Successful Equipment Test at Bishop Gold Mill, Inyo County, California • NBRI • Apr 23, 2024 9:41 AM
Epazz, Inc.: CryObo, Inc. solar Bitcoin operations will issue tokens • EPAZ • Apr 23, 2024 9:20 AM
Avant Technologies Launches Advanced AI Supercomputing Network and Expansive Data Solutions • AVAI • Apr 23, 2024 8:00 AM
BestGrowthStocks.com Issues Comprehensive Analysis of Triller Merger with AGBA Group Holding Limited • AGBA • Apr 22, 2024 1:00 PM
Cannabix Technologies to Present Marijuana Breathalyzer Technology at International Association for Chemical Testing (IACT) Conference in California • BLO • Apr 22, 2024 8:49 AM

