US Dollar Index Chirping – Will Last if Non-Commercials Jump Onboard By Hedgopia | August 17, 2017
The US dollar index (93.44) of late is showing some nice price action. Will it be enough to lead non-commercials to begin to accumulate net longs in US dollar index futures?
A sustained rally can reverberate through a whole host of assets, including commodities, stocks, and what have you.
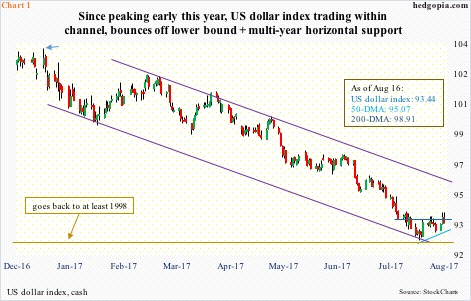
The index came under serious pressure since it peaked on January 3 at 103.82 (blue arrow in Chart 1). Through the intraday low of 92.39 on August 2, it shed 11 percent. In the currency land, this is no chump change.
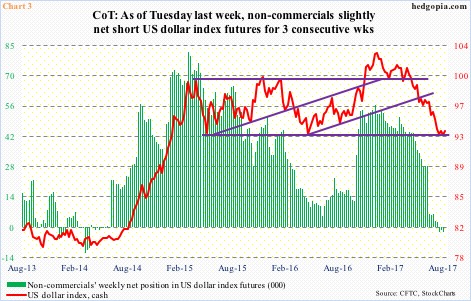
Prior to reaching that high, the index broke out of horizontal resistance at 100.70 going back to March 2015 (arrow in Chart 3). Turns out that was a false breakout.
Before it started going sideways in March 2015, the index rallied 26 percent in nine months. Down below, support at 92-93 consistently held. The bottom end of that range was just tested – so far successfully.
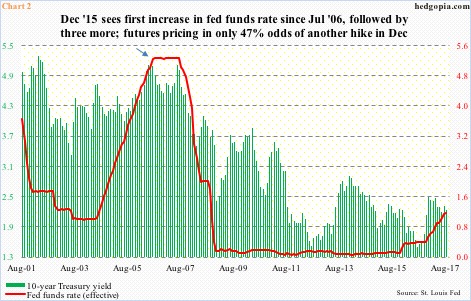
The improvement in price action was not caused by a rise in hawkish FOMC posture. The futures market is currently pricing in 47 percent odds of a hike in December (12-13) this year.
So far in the current cycle, there have been four 25-basis-point hikes.
December 2015 was when the Fed moved first – the first hike since July 2006 (arrow in Chart 2) – and the latest was in June this year. The fed funds rate currently stands at 1.16 percent.
The problem is, the long end is not cooperating, with the spread between 10- and two-year yields currently at 90 basis points, lower than the 128 basis points on December 16, 2015 when the Fed first moved.
Interest-rate dynamics are not behind the latest signs of stability in the US dollar index.
It is possible dollar sentiment got so low it could not go any lower – not this time anyway.
When the dollar index began to go sideways in March 2015, this coincided with a peak in non-commercials’ net longs in US dollar index futures, before they unwound them (Chart 3). Later in mid-December last year, shortly before the cash peaked, they once again began to cut back net longs. In the past three weeks, they have switched to net short. Quite a U-turn!
These traders have timed the ups and downs in the cash pretty well, and how they position themselves going forward may make or mar the incipient rally in the cash.
Dollar bulls have reason to be optimistic, if for no other reason than technicals.
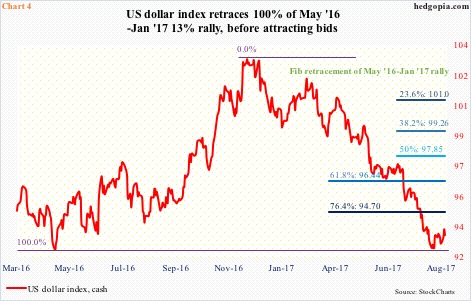
In May last year, the cash dropped to 91.88 before hammering out a weekly hammer reversal. This eventually peaked in the afore-mentioned January high this year. At the low on August 2, the entire rally was retraced – an important development for Fibonacci followers (Chart 4).
Support at 92 also goes back to at least 1998. Not to mention the fact that this coincides with the bottom of a channel going back to January this year (Chart 1). After the August 2nd low, there have been higher lows, but resistance at 93.65 is holding.
So long as this low is not violated, the bulls have the ball. If non-commercials jump on board, they can run with it for a while. We will learn these traders’ latest (as of Tuesday) holdings tomorrow.
Information posted to this board is not meant to suggest any specific action, but to point out the technical signs that can help our readers make their own specific decisions. Your Due Dilegence is a must! • DiscoverGold
Register for free to join our community of investors and share your ideas. You will also get access to streaming quotes, interactive charts, trades, portfolio, live options flow and more tools.


 News
News  Market Data
  Discover