:::: YTD SPY Outflows Distort Picture – Include VOO And IVV, Reality Emerges By Hedgopia | July 17, 2017
Yet another high on the S&P 500 large cap index – 25th new closing high year-to-date. The index is now $21 trillion rich!
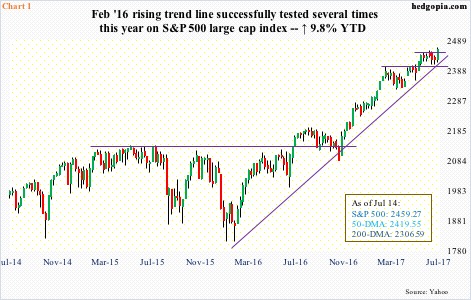
To reach that milestone, it rallied 0.5 percent last Friday to 2463.54 before closing at 2459.27 – kind of a mini break out of 2445. This follows a break out of 2400 on May 24, which, along with the 50-day moving average, was tested several times before the Friday rally.
The weekly low last week once again tested – successfully – a rising trend line from February last year (Chart 1).
That said, weekly MACD has diverged with the price for several weeks now. Thus far, the buy-the-dip crowd remains active, and has been right. This may change once the trend line is broken – possible in the weeks ahead given the divergence and slowing momentum.
For now, the index is up 9.8 percent year-to-date.
One look at Chart 1, and one gets the impression that flows are fully cooperating. Yet, SPY (SPDR S&P 500 ETF) has lost $10.5 billion this year (through July 13). Of course, this is not the only source of funds. Others are cooperating.
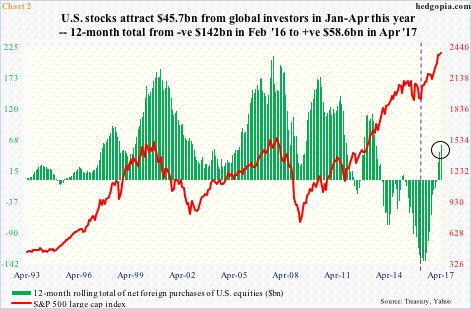
Foreigners in particular have been a positive force this year. Net foreign purchases of U.S. equities in January-April were $45.7 billion. On a 12-month rolling total basis, they bought $58.6 billion worth in April. Quite a reversal from February 2016 when they were selling as much as $142 billion – a record.
The negative green bars on the right side of Chart 2 began to gradually shrink from February 2016, but it was not until February this year they turned positive. The trend has reversed. Incidentally, U.S. stocks reached an important bottom in February last year (Chart 1).
Margin debt has acted as another reliable source of funds.
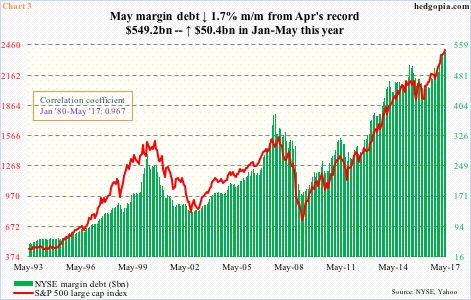
After peaking at $507.2 billion in April 2015, margin debt bottomed at $435.8 billion – once again – in February last year.
The April 2015 high was surpassed this January. By April, it rose to $549.2 billion – a new record. It dropped $9.3 billion month-over-month in May, but was still up $50.4 billion in the first five months of the year. With a correlation coefficient between NYSE margin debt and the S&P 500 of near-perfect 0.97, the former has been a tailwind to the latter.
With this as a background, the $10.5 billion redeemed year-to-date from SPY makes one wonder if longs are locking in profit. Unless one looks deeper.
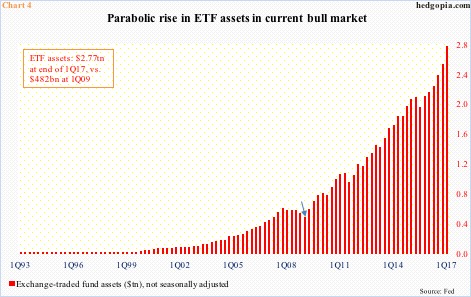
The ETF industry has grown by leaps and bounds.
As of 1Q17, it was $2.8 trillion strong. This is from the Fed’s quarterly Z.1 report. ICI data for May show the industry has grown further to $2.9 trillion (not shown here).
As early as 1Q09, ETF assets were $482 billion (arrow in Chart 4). The bull market in U.S. stocks began in March that year, meaning assets have grown by $2.3 trillion since.
This astounding growth in assets has witnessed Blackrock’s iShares, Vanguard, and State Street’s SPDR rise to the top three. They each offer ETFs tracking the S&P 500. SPY is offered by State Street, VOO by Vanguard and IVV by iShares.
In terms of assets, SPY is the largest of the three – $236 billion. IVV has an AUM of $118 billion, and VOO $71 billion.
Here is the kicker.
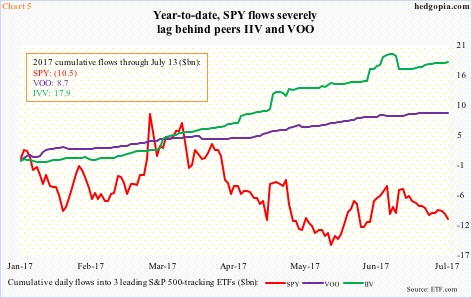
Year-to-date, unlike SPY, the other two have seen inflows – $17.9 billion into IVV and $8.7 billion into VOO (Chart 5). (Not sure if this has been a factor in flows dynamics, but SPY’s expense ratio is 0.09 percent, versus 0.04 percent for the other two.)
Evidently, what SPY lost is more than offset by gains in the other two.
Money flows make up an important analytical tool in investing. But the rapid growth of the ETF industry makes the analysis a bit tricky. There are literally thousands out there. Several target the same discipline, as is the case with SPY/IVV/VOO. In this example, to get a clean picture, one needs to focus on all three as inputs, not just SPY. Otherwise, the output is distorted.
Information posted to this board is not meant to suggest any specific action, but to point out the technical signs that can help our readers make their own specific decisions. Your Due Dilegence is a must! • DiscoverGold
Register for free to join our community of investors and share your ideas. You will also get access to streaming quotes, interactive charts, trades, portfolio, live options flow and more tools.


 News
News  Market Data
  Discover