


Saturday, July 15, 2017 12:22:43 PM
=> Total Revs May06-Apr17: $231.2mm/Avid + $24.1mm/Govt + $2.4mm/Lic. = $257.8mm.
Cash at 4-30-17: $46.8mm (Op. Cash Burn for q/e 4-30-17 was $3.9mm – see below).
As of Jul. 10, 2017, there were 45,069,188 shares outstanding. (10K 4-30-17 iss. 7-14-17 http://tinyurl.com/ycxu4l5n )
...NOTE: PPHM shares were 1:7 Reverse Split eff. 7-10-17 (315mm/$.606=>45mm/$4.24) http://tinyurl.com/ycohqn6j
This large post has 4 sections:
I. 7-14-17 Q4/FY17 Qtly. Earnings Conf. Call TRANSCRIPT (fy/e 4-30-17)
II. 7-14-17 PPHM Press Release: Q4/FY17 Earnings & Developments
III. A link to “O/S Shares & ATM Sales History – 2006-curr.” ( http://tinyurl.com/yagmu2on )
IV. Updated Table of Avid Revenues By Quarter (May’06-Current)
…Recall: Peregrine’s FY runs May-Apr, so FY’17 = May’16-Apr’17.
((( Orig. transcript from SeekingAlpha.com [http://tinyurl.com/y7ae7cqj ], with numerous corrections made. )))
Link to webcast replay: http://ir.peregrineinc.com/events.cfm => http://edge.media-server.com/m/p/yx85d7e7
FULL TRANSCRIPT… 7-14-17 FY’17/Q4 Earnings Conf. Call (fy/e 4-30-17) (King/Shan/Lytle)
WELCOME & FWD-LOOKING STATEMENTS: Tim Brons, Vida Strategic Partners (IR) http://www.peregrineinc.com
CEO STEVE KING – OPENING COMMENTS:
Thanks to all of you who have dialed in and all of you who are participating via webcast today. As most of you’re aware, Peregrine has a diverse business with a common goal of improving the lives of patients with serious diseases. We do this by manufacturing high-quality pharmaceutical products through our contract manufacturing business, Avid Bioservices, and by advancing cancer therapies & diagnostics, led by bavituximab, our novel immunotherapy product, through our R&D company, Peregrine. We continue to believe there are significant opportunities for both of these businesses, but also recognize they are very distinct businesses with very different roads to success.
I will first discuss recent highlights with the 2 companies and then more about potential plans to ensure the success of both companies. We’re very pleased to announce that Avid Bioservices recorded its highest annual revenues to-date during FY17, topping $57mm, representing 30% growth over the prior FY. Revenues could have been even higher if not for the need to delay shipment of several already released lots of materials due to the needs of the customer. While we’re pleased at the continued yr-over-yr revenue growth, we are projecting relatively flat revenues this FY due to recent changes in a large customer’s [Halozyme] forecasts and a delayed regulatory filing for another significant customer. We expect both of these factors to be temporary and remain confident that Avid will continue to achieve growth in the future, as these customers are successful and as we add new customers to diversify our client base. And on that front, we have recently signed 4 new customers that we expect to contribute significantly to top line revenues in the future.
In addition, we successfully completed 3 process validation campaigns for existing third-party customers, which again, we believe can have a significant revenue impact as the customers make regulatory filings and begin to move toward inventory builds for potential launch, followed of course by the potential for commercial supply. In addition to securing new customers and setting the stage for commercial production, we are continuing to make other important steps to ensure Avid’s growth in the coming years. As part of this effort, we have recently installed 2 new 2,000L bioreactors in our Myford facility, and we have already secured commitments for this capacity. Due to its state-of-the-art modular design, there is the potential to install addl. bioreactors in our Myford facility, which will allow us to continue to meet the increasing demand and grow the future business with our current facilities. Another part of our effort to attract new customers is to expand our service offerings. Our scientists have developed a state-of-the-art antibody discovery & characterization platform through which we can generate antibodies against virtually any target. These capabilities are meant to allow rapid screening for high affinity antibodies that are developable. These capabilities are a natural extension of the services we already offer through Avid and it represents an attractive way to bringing customers at a much earlier stage of development with the potential to move them quickly into process developments and cGMP manufacturing.
Switching gears to our R&D activities. While meeting our goal of reducing overall R&D spending by over 50% during FY17, we were also able to generate some of the most compelling data to-date supporting the combination of bavituximab & checkpoint inhibitors. We are working with some of the best institutions in the world that have been involved in the development of cancer immunotherapies. Perhaps the most important recent preclinical findings came through original research from our collaborators at Memorial Sloan Kettering Cancer Center (MSKCC). The researchers at MSKCC [Jedd Wolchok’s Lab] presented promising preclinical data [4-3-17/AACR17: http://tinyurl.com/lxlltd6 ] combining PS-targeting antibodies with adoptive T cell transfer therapy [ACT: CAR-T], which may support the combination of bavituximab with CAR-T cell immunotherapy in the future.
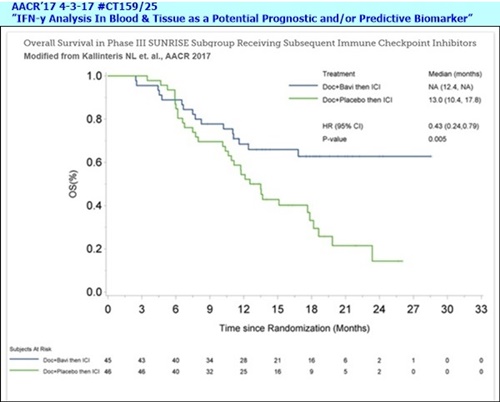
On the clinical front, we presented data from an analysis of the maturing SUNRISE Phase III trial [4-3-17/AACR17: #CT159/25, “IFN-y Analysis In Blood & Tissue as a Potential Prognostic and/or Predictive Biomarker” (Sunrise Biomarker #3) http://tinyurl.com/ktzr782 ], showing that patients in the arm that received bavituximab and subsequent immune checkpoint inhibitors lived significantly longer than those on the cohorts that received placebo and subsequently went on to immune checkpoint inhibitors. The data was impressive. It has been very well received by KOLs, and we believe strongly supports advancing bavituximab in combination with immune checkpoint inhibitors, such as PD-1 & PD-L1 inhibitors. Joe will talk more about this data shortly.
The data presented at AACR by the researchers at MSKCC and Peregrine collectively provide growing validation for the potential bavituximab in combination with immune stimulating therapies. Such as those we are exploring our collaboration with the National Comprehensive Cancer Network (NCCN), which will evaluate novel bavituximab combinations in Glioblastoma, Head & Neck cancer, and Hepatocellular Carcinoma, including a PD-1 combination. This collaboration is advancing well and again Joe will provide more details on the 3 trials during his prepared remarks.
The Antibody Discovery Platform discussed earlier [Avid] could also be instrumental on the R&D side of the business, allowing us to rapidly identify antibodies against already validated targets, as well as the potential to identify novel targets. As we think about diversifying our development pipeline to include lower risk, already validated targets, this new capability could help us to identify developable antibodies that could have short-term value, as the need for such antibodies is on the rise. And this approach fits very well into our core capabilities and experience in the development of monoclonal antibodies. You can expect to hear more about this new capability over the coming months on both sides of our business.
Lastly, on the R&D side, we are pleased to report that the company continues to make progress with its PS-targeting Exosome Diagnostic Technology that is designed to detect & monitor cancer. Our scientists have successfully optimized the assay and we are currently preparing to generate addl. Data, testing the diagnostic with an expanded set of human samples. Such data will be important to partnering discussions and we’ll keep you posted on progress.
[**6-22-17: Nature/BJC article, Dr. Alan Schroit/UTSW etal: "Detection of PS+ Exosomes for the Diagnosis of Early-Stage Breast & Pancreatic" http://tinyurl.com/ycrx9672
**2-9-17/PR: PS+ Exosomes Proof-of-Concept Data (N=44, Ovarian, Dr. Alan Schroit/UTSW etal) pub. 1-22-17 in OncoTarget http://tinyurl.com/jhv57ua ]
Both Peregrine & Avid have achieved important milestones in recent quarters. We are proud of both businesses and believe each has strong potential. However, we also recognize that they have very different business models and pathways to growth. As a result, we understand that some of our shareholders have divergent goals for the company’s future, depending on if they’re more focused on Avid or our R&D business [7-13-17: Ronin/SW-Invest Letter to Stockholders; PPHM Comments http://tinyurl.com/ybr8ycbp ]. So, as part of our continuous evaluation of various strategic options that we believe they enhance value for all of our stockholders, we are seriously considering the possibility of separating our 2 distinct businesses. We’re still at the early stages of evaluating this strategic opportunity, but are diligently moving forward with the analysis. I’ll now turn the call over to the other members of our team, who will give a detailed overview of our clinical, corporate, and CDMO activities.
JOE SHAN (VP/Clin.&Reg. Affairs) – CLINICAL TRIALS:
As Steve mentioned just a few moments ago, despite a significant reduction in R&D spending over the past FY, we were able to continue patient treatment & follow-up in the Phase III SUNRISE trial thus allowing the clinical data to further mature.
At the AACR annual meeting in April, we presented the most important and compelling data to-date supporting bavituximab’s potential to improve the outcome of anti-PD-1 or PD-L1 immune checkpoint inhibitors [4-3-17/AACR17: #CT159/25, “IFN-y Analysis In Blood & Tissue as a Potential Prognostic and/or Predictive Biomarker” (Sunrise Biomarker #3) http://tinyurl.com/ktzr782 ]. Among a subgroup of 91 patients who are treated with checkpoint inhibitors subsequent to the assigned SUNRISE treatment, MOS was not yet reached for the 45 patients who received docetaxel+bavituximab compared to a MOS of 13mos. for the 46 pts. who received docetaxel+placebo, with a hazard ratio of 0.43 and p=0.005. The statistically significant difference in survival provides strong clinical rationale for combining bavituximab with checkpoint inhibitors. We are encouraged by the positive response received from investigators & thought leaders regarding this subgroup analysis and exploring ways to advance the program as resources permit. In the meantime, as we focus the biomarker analysis on this subgroup of patients, we are seeing some intriguing results and plan to present our findings at key conferences later in the year.
At ASCO in June, we presented addl. supportive data [6-3-17/ASCO'17: "Prelim. Correlative Analysis of PD-L1 Expression from the Sunrise Study” http://tinyurl.com/y93upatl ] demonstrating that patients in the bavituximab containing arm who had low PD-L1 baseline expression on tumor cells, who typically experience poor response to PD-1 or PD-L1 checkpoint inhibitors, led significantly longer than patients with high baseline PD-L1 expression. These data further support the hypothesis that bavituximab may modulate the tumor microenvironment to complement enhance the anti-tumor activity of checkpoint inhibitors.
So the SUNRISE trial database was locked at the end of March of this year. Patients who were still receiving bavituximab at that time were transitioned to compassionate use program and some continue to remain on treatment. We believe bavituximab is active, as some patients have been on treatment for as long as up to 2.5 years and has a good safety profile, making it a useful candidate for combining with other therapies and we remain deeply committed to advancing the growth.
Now, let me provide a brief update in our collaborations, starting with the NCCN trials. At present, 2 of the 3 trials are now opened for enrollment. The 3rd trial at The Sidney Kimmel Comprehensive CC at Johns Hopkins is a Phase II Study of Pembrolizumab & Bavituximab for Recurrent or Metastatic Head & Neck cancer that has progressed on anti-PD-1 therapy, and this trial is expected to be initiated by the end of the year.
----------NCCN:
[NCCN Bavituximab Trials Announced 9-6-16 http://tinyurl.com/gutgwb5
...#1: Ph1/HepC-Related Hepatocellular(Liver) (Bavi+RAD+Bayer’s Nexavar=Sorafenib), MOFFITT CC (N=18)
. . . . . . .PI: Jessica Frakes, MD https://clinicaltrials.gov/ct2/show/NCT02989870 <=Recruiting a/o 3-27-17
...#2: Ph2/Newly Diag. Glioblastoma (Bavi+RAD+Merck’s Temodar), MASS-GEN. & DANA FARBER (N=36)
. . . . . . .PI: Elizabeth Gerstner, MD https://clinicaltrials.gov/ct2/show/NCT0313991 <=Recruiting a/o 6-16-17
...#3: Ph2/Progressive Squamous Head+Neck (Bavi+Merck’s Keytruda), JOHNS-HOPKINS(Sidney Kimmel CC)
. . . . . . .PI: Ranee Mehra, MD https://clinicaltrials.gov/ct2/show/XXXXXXXXX - See Dr. R.Mehra Jan'17/IFN-y Biomarker: http://tinyurl.com/h8gzkww
Last but certainly not least, our collaborators at MSKCC [Jedd Wolchok Lab] presented a preclinical study at the AACR Annual Meeting which evaluated and compared the anti-tumor activity and side effects of adoptive T cell transfer therapy [“ACT”] in combination with either PS-targeting or anti-OX40 antibodies in mice with advanced melanomas. While PS-targeting and anti-OX40 demonstrated comparable tumor regression when administered in combination with adoptive T cells, only the PS-targeting combination achieved these results without any off-target toxicities. In contrast, the anti-OX40 treatment combination elicited off-target inflammatory side effects. Toxicities have limited the clinical potential of adoptive T cell transfer and CAR-T approaches to-date. The absence of toxicity with PS-targeting in adoptive T cell transfer in this initial mouse melanoma experiment may have important future implications for combination strategies and solid tumors.
-----------
[4-3-17/AACR’17 #1651, Joint PPHM & Memorial Sloan Kettering, “Targeting Phosphatidylserine in Combination with Adoptive T Cell Transfer Eliminates Advanced Tumors without Off-Target Toxicities in a Melanoma Preclinical Model”, Daniel Hirschhorn-Cymerman, Jedd Wolchok, Taha Merghoub, etal http://tinyurl.com/lxlltd6 ]
I’ll wrap up by saying how excited we are about these recent clinical & preclinical findings, which really set the stage for combining bavituximab with other immunotherapies and we look forward to providing updates on our progress over the coming months.
PAUL LYTLE (CFO): [4-30-17 10K iss. 7-14-17: http://tinyurl.com/ycxu4l5n ]
Let me switch gears now to discuss our financial results for the qtr and full FY17. Our overall guidance this past FY focused on increasing revenue from our contract mfg. business, Avid, while also reducing our spending on R&D, as we seek to position the company closer to overall profitability. During FY17, we achieved both a substantial increase in revenue and a significant reduction in R&D expenses. Let me first talk about top line revenues. Contract mfg. revenue for Q4/FY17 was $17.9mm and $57.6mm for the full FY, representing 30% yr-over-yr growth. And while we missed the low-end of our revenue guidance of $60mm, we were ready to ship approx. $10mm in mfg. revenue at the end of the FY that was unfortunately delayed due to events outside Avid’s control. This revenue will now be shifted from FY17 into FY18.
Regarding our revenue guidance, as Steve mentioned earlier, we currently expect revenue in FY18 to remain consistent with FY17. As temporary production roles are a common part of the CDMO industry, it emphasizes the need to continually expand & diversify our customer base. During FY16 and prior to the Myford facility being built, we had minimal available production slots in our Franklin facility to offer to new customers, and therefore, we had historically limited abilities to diversify our customer base. And as we built and commissioned the state-of-the-art Myford facility in March of 2016, diversifying our customer base was a key focus. We immediately secured one new customer that has completed process validation at Myford and we have recently signed project work for 4 new customers, including one project that is in late-stage development. Based on our current book of business, we are providing FY18 revenue guidance of $50-55mm, which is consistent with the revenue projections we made at this time last year. This projection is based on current information and is supported by current revenue backlog of approx. $58mm under signed contracts, most of which we expect to recognize during FY18.
I’ll now address our efforts to reduce overall spending on R&D. As we announced last June, our internal drug development strategy has shifted away from large late-stage clinical trials to small, cost effective, early-stage clinical trials designed to attract potential partners to further advance our products. Our goal in adopting the strategy was to further reduce R&D spending by 50% in FY17 vs. FY16. We’re pleased to report that our R&D expenses declined 52% over the same prior year period exceeding our targeted reduction. Although we have generated some of the most promising bavituximab data to-date as Steve and Joe just covered, we’re still expecting to further reduce R&D spending by 40% or more in FY18, unless we can secure addl. funding to further advance this program in connection with exploring the various strategic options, including a possible separation of our 2 distinct businesses. In summary, the increase in mfg. Revenue, combined with a decrease in R&D spending, has translated into a reduction in our net loss by 56% for the qtr and 49% for the full FY17 vs. the same prior year period.
Switching gears now, I’d like to provide a quick update on the recently effected reverse stock split [1:7 eff. 7-10-17]. As I outlined during the Q3 earnings call, Peregrine was committed to taking the necessary steps to preserve its NASDAQ listing. While we executed this R/S as a last resort, we firmly believe that doing so was in the long-term interest of our stockholders. To maintain our continued listing on NASDAQ Capital Market, our min. closing bid price has to close at or above a $1 for 10 consecutive trading days. As of the close today, we are now 5 days into that process with a min. closing bid of $1 or higher. This concludes my financial overview.
Q&A: [beg. 20:30]
1. Kumara Raja - Noble Life Science Partners http://noblelsp.com/research
KR: ”Given that revenues are going to be flat comparatively yr-over-yr, how should we think about expenses, ways of reducing R&D expenses? And also costs were higher. When do you expect margins to start getting better?”
Steve King: As revenues fluctuate, we have to watch the costs associated with both the biomanufacturing business as well as our R&D expenditures. If you look at this year’s R&D budget, it is even significantly down from last year. So that that’s going to be further cost savings on the R&D side. Of course, that’s kind of counterintuitive, given the fact we have some really exciting data coming out. Thats one of the reasons we’re looking at the strategic alternatives is really feel like we should be putting more money into R&D, not taking more money out of it, but we also have to deal with financial realities of today, and so we’ll make those adjustments as we go along. But, our goal is to find a strategic alternative that will allow us to move the R&D sort of forward independently of the Avid business. On the Avid side as far as cost of goods go, part of that was bringing on board the Myford facility. So last year, even though we did obviously some nice business in the facility and it’s been busy since day one, it’s still not running at full capacity when you do the process validations, they’re a little bit more cumbersome, a little bit more complex, so there’s more costs associated with those runs. As we get into more full utilization of the facility in kind of campaign mode, where you’re running multiple runs of the same product simultaneously, we’ll see those cost of goods come down, because they simply get spread out over more runs. We’re constantly looking at the business adjusting the expenses in order to continue to have a profitable biomanufacturing business and also to watch your overall corporate finances.
KR: And in terms of making a strategic decision in terms of separating the mfg. vs. the clinical trials business, what are you all thinking in terms of the timeline for making such a decision? And what kind of challenges and opportunities do you see there? Also, on on the clinical data presented at ASCO, obviously, you guys are seeing that patients who had low PD-1 expression, they are surviving longer. For these patients, what treatments are there on after moving from bavituximab? Are there on any other treatments, or are they just continuing on bavituximab?”
Joe Shan: The ASCO presentation you referred to was analysis done on a subset of patients selected by whether or not we had tumor tissue to evaluate the PD-L1, and that ended up being relatively small percentage of the total number of patients enrolled in the SUNRISE trial. We’ve not dissected that small number of patients further by what treatment they went on after SUNRISE trial. So…
Steve King: Most of the patients that did receive the subsequent immunotherapy, it was all primarily PD-1 inhibitors, probably all primarily Opdivo, given the timing as far as that subset, but the rest of the data, as Joe said is – can certainly [ph] as small numbers. On the opportunities for the businesses as far as the kind of the process, I think, it is a process. Obviously, there’s a lot of considerations that you can imagine that need to be taken into account, as we’re looking at different structures that might work and thinking about all those avenues. There’s things such as taxes, where we have to think about. There’s the overall net operating losses of the company that we want to make sure we get full utilization of. So there’s just a lot of complexities. So we don’t currently have a particular timeline we’re marching to. I would say, we will diligently move forward the thinking process and at the appropriate time, we’ll update as we get closer and closer to be in a position to have a clear direction.
Paul Lytle: And Kumar, looking at a number of potential opportunities, so which type of opportunity that we move forward with will basically dictate the timeline.
2. Andrew De Silva (B. Riley & Co.): http://brileyco.com/research
AS: ”On Avid’s committed contracts thus far to-date, do you have a sense as when some of these higher revenue periods should hit? Will they smooth out or be lumpy like it was last year in your opinion? And, what needs to take place for you to get closer to the 40-50% GM% range?”
Paul Lytle: Overall, the CDMO business generally has lumpy revenue streams, because you have a mix of customers, sometimes they’re in an earlier stage and they do a few mfg. runs and then they go away for a while and they come back for the next set of runs. And then you have commercial supply, where it can go up and down depending on the product and the launch and the timelines of your commercial customers. With respect to our particular lumpiness, we’ve had issues with our third-party vendors, where we have delays in testing over the last FY year that caused some lumpiness in our revenue streams. So our goal is to expand & diversify our customer base. The more customers we have in the mix, the less lumpy the revenue streams would be. We also want to make sure we secure good commercial customers, like the ones we have today, that that do provide kind of a consistent consistent need for manufacturing. The more diversified you can get and more commercial you can get, the less lumpiness you’ll see in future revenues and that’s our kind of our goal moving forward. I think we’re going to see some lumpiness in terms of FY18, but as our customers submit their BLAs and go through the commercial launch & inventory builds that Steve mentioned earlier, I think you’ll see less lumpiness going forward in the FY19 time period.
AS: Is it still too early for you guys to get a sense of what the quarterly impact might be this year from a seasonality standpoint?”
Paul Lytle: Yes, it’s a quite complex in terms of timing and lot release. As we mentioned in the script, we had $10mm in revenue that was expected to ship by the end of April, and due to unforeseen events that were outside our control, that now has shifted into FY18, so that’s a large lumpy number.
AS: ”re: R&D, you mentioned that that should continue to decline yr-over-yr. I’m just kind of curious how does that work now that you’re expected to start a Phase II trial [NCCN/Head+Neck] in the back-half of this FY?”
Steve King: At this point we haven’t committed to starting new studies. The only new studies that we’ve committed to are the NCCN studies, which were all funded under a $2mm grant. Those are the only ones we are really committed to, and in order to start new studies beyond that, it’s one of the reasons that we’re looking at the strategic alternatives for the company, because I think in order to do that, we need to raise dedicated funding for that. At the same time, we recognize that for the Avid business continue to grow, we should raise dedicated funding for that business, in order to add on to our capabilities to upgrade some of our capabilities and then to add on more capacity at the right time. So, right now it’s sort of status quo as we move forward on the R&D front, and as we’re able to really have a clearly defined pathway forward for the R&D business with the appropriate funding, then I know our group already has some plans of what could be the next study designs.
Paul Lytle: The Phase II that you alluded to that that does fall under our $2mm NCCN grant, some of which was paid last FY year and then there’s some being paid this FY. But that covers 3 trials being run by this NCCN consortium.
AS: ”So there shouldn’t be too much of an impact then as we go through the year unless you guys decide to be more aggressive or able to get the adequate funds?”
Paul Lytle: Correct.
AS: ”You talked about potential strategic relationships and you have a preclinical collaboration with Sloan Kettering. Can you elaborate how that collaboration gets extended into a clinical work? And then how it works when you tie into a strategic partner? Does that all have to be rehashed out, or are there some covenants in there that make that a simple process?”
Steve King: One of the goals of the group is that Sloan Kettering is to directly translate what they’re doing on the preclinical front into clinical studies at the institution. And so, they typically only want to work on things that they have that opportunity for. If we think about the possibility of bavi in combination with CAR-T therapy, then we would expect that once they’ve generated the right amount of data then we would have a discussion with obviously one of the CAR-T companies about collaborating on moving that forward under the umbrella of the group there at Sloan Kettering. We’re working with probably the top immunology lab [Jedd Wolchok’s Lab] when it comes to the development of immune checkpoint inhibitors there, and they have very, very tight clinical connections. Jedd Wolchok obviously is the head of the lab there and he’s very well connected. So, we would expect actually that some doors can open through the collaboration and through the introductions, because we know the clinicians at Sloan Kettering already work with all the major pharma, and so there are already good connections there that can help really hopefully expedite those into clinical development.
AS: ”Does it have to be CAR-T, or other immuno-oncology optionalities open as well, or are you kind of just focused strictly on that vertical right now?”
Steve King: That’s [CAR-T] is one of their favorite projects, so they’ve really been excited about the data, because if you look at the results were presented, it’s really the ability of bavituximab to enhance the activity of the adoptive T cell therapy vs. the lack of any additional toxicity. And, when they compared it with an agent like OX40 that actually also increased activity, but also had more safety events, then they really like that approach. But no, this could extend to PD-1/PD-L1 probably quite a number of other molecules that there’s an interest in. So, there’s a lot of interest across the board, because as the field is maturing and more results are coming out, you’re running into two things. One is, drugs just don’t work well together either from a safety standpoint or there’s no enhanced efficacy, and we’re seeing more & more of that reported. I think there’s a real window of opportunity here. In addition, you have patients that are on treatments that develop a resistance to the therapies, and that opens up another door for, based on the mechanism of action for bavi, to potentially reinvigorate the ability of the PD-1/PD-L1 inhibitors. The Sloan Kettering Group, there are quite a number of actual researchers that are working on it, each of which are looking at different aspect. CAR-T and adoptive T cell is just simply one of those.
MR. KING’S CLOSING COMMENTS:
I’d like to thank you all again for participating in today’s phone call. As always, I want to thank you, our stockholders, for your continued support, and I would like to specially thank our patients, their families and the investigators that are participating in our bavituximab clinical trials. With that, we will conclude the call.
= = = = = = = = = = = = = = = = = = = = = = = = = = = = = == = = =
7-14-17/PR: Peregrine Pharmaceuticals Reports Financial Results for Quarter and FY Ended April 30, 2017 and Recent Developments
**Avid Achieves Year-Over-Year Topline Revenue Growth of 30% Exceeding $57 Million
**Overall Survival in Phase III SUNRISE Subgroup Receiving Subsequent Immune Checkpoint Inhibitors
**Recent Presentation Supports Bavituximab's Potential to Improve Clinical Outcome for Immune Checkpoint Inhibitors
http://ir.peregrineinc.com/releasedetail.cfm?ReleaseID=1033237
TUSTIN, July 14, 2017: Peregrine Pharmaceuticals, Inc. (NASDAQ:PPHM/PPHMP), a biopharmaceutical company committed to improving patient lives by manufacturing high quality products for biotechnology and pharmaceutical companies, and advancing its proprietary R&D pipeline, today announced financial results for the fourth quarter and fiscal year (FY) ended April 30, 2017, and provided an update on its contract manufacturing operations, research and development programs, and other corporate highlights.
Highlights Since January 31, 2017
"We are very pleased to announce that the business recorded its highest annual revenue to date during fiscal 2017," stated Steven W. King, President & CEO of Peregrine, and President of Avid Bioservices. "While we are happy to report continued year-over-year revenue growth, we are projecting revenues for FY 2018 to be similar with FY 2017 due to recent changes in the forecast of a large customer and a delayed regulatory filing for another customer. We believe this is a temporary lull and remain confident that Avid is in a strong position for continued growth in the future." Mr. King continued, "An important part of continuing revenue growth and reducing risk for the business is to attract new customers. On that front, we have recently signed four new customers that we expect to contribute to top-line revenue in FY 2018 and into the future. In addition, we successfully completed three process validation campaigns this fiscal year for existing third-party customers which we believe may significantly contribute to future revenue as these customers move toward building inventory for their potential launch, and commercial supply.
"We are also continuing to take other important steps to ensure Avid's growth in the coming years. As part of this effort, we have recently installed two new 2,000 liter bioreactors in our Myford facility, and we already have commitments for part of this capacity. Due to its state-of-the-art and modular design, there remains potential to install additional bioreactors in Myford, which will allow us to continue growing the business within our current facilities.
"Turning to the Peregrine business, we were able to generate some of the most compelling bavituximab data to date, further supporting the combination of bavituximab and checkpoint inhibitors even while reducing R&D spending by over 50% in FY 2017. The clinical findings came from the comprehensive analysis of maturing Phase III SUNRISE data while impressive preclinical results came from our collaborators at Memorial Sloan Kettering Cancer Center (MSKCC). The researchers at MSKCC presented promising preclinical data combining PS-targeting with adoptive T cell transfer therapy which may support the combination of bavituximab with CAR-T cell immunotherapy in the future.
"Both Peregrine and Avid have achieved important milestones in recent quarters. The success of Avid and its continued revenue growth with the compelling data we have seen from the Phase III SUNRISE trial have led us to explore various strategic options that we believe will enable us to enhance stockholder value for all stockholders, including the possible separation of these two distinct businesses."
Research and Development Highlights
"The most compelling data to date from the Phase III SUNRISE trial was presented at AACR and together with the PD-L1 results presented at ASCO this year add to the growing body of data supporting the further development of bavituximab with checkpoint inhibitors," said Joseph Shan, VP of Clinical & Regulatory affairs at Peregrine.
AACR Highlights:
In a subgroup analysis, Peregrine researchers looked at the outcome of 91 patients that were enrolled in the Phase III SUNRISE trial that were subsequently treated with anti-PD-1/PD-L1 immune checkpoint inhibitors ("ICI's") post study treatments. The results from this analysis demonstrated that the patients who received docetaxel plus bavituximab (Doc+Bavi) and subsequent ICI had not yet reached median overall survival ("mOS") compared to mOS of 13.0 months for patients who received docetaxel plus placebo (Doc+Placebo) (hazard ratio [HR], 0.43; p=0.005). The statistically significant difference between the two arms in the trial provides strong rationale for combining bavituximab with ICI's and supports the hypothesis that bavituximab may modulate the tumor microenvironment to enhance the anti-tumor activity of ICI's.
A photo accompanying this announcement is available at http://www.globenewswire.com/NewsRoom/AttachmentNg/428c1a61-a599-4976-8a92-d65148671bcd
ASCO Highlights:
Peregrine researchers presented additional supportive data demonstrating that patients in the bavituximab containing arm who had low baseline PD-L1 expression on tumor cells (i.e., patients typically with poorer response to PD-1/PD-L1 checkpoint inhibitors) lived significantly longer than patients with high baseline PD-L1 expression. These data further support the hypothesis that bavituximab may modulate the tumor microenvironment to complement and enhance the anti-tumor activity of ICI's.
NCCN Highlights:
The three clinical trials under the collaboration with the NCCN are advancing as planned.
Massachusetts General Hospital Cancer Center - Phase I/II Clinical Trial of Bavituximab with Radiation and Temozolomide for Patients with Newly Diagnosed Glioblastoma. This trial is open for enrollment.
Moffitt Cancer Center - A Phase I Trial of Sorafenib and Bavituximab Plus Stereotactic Body Radiation Therapy for Unresectable Hepatitis C Associated Hepatocellular Carcinoma. This trial is open for enrollment.
The Sidney Kimmel Comprehensive Cancer Center at Johns Hopkins - Phase II Study of Pembrolizumab and Bavituximab for Progressive Recurrent/Metastatic Squamous Cell Carcinoma of the Head and Neck. This trial is expected to be initiated by the end of the calendar year 2017.
Preclinical Highlights:
Researchers from Memorial Sloan Kettering Cancer Center (MSKCC) presented a preclinical study evaluating the anti-tumor activity and toxicities of adoptive T cell transfer therapy in combination with either PS-targeting antibodies or anti-OX40 antibodies in mice with advanced melanomas. Whereas PS-targeting and anti-OX40 demonstrated comparable tumor regression when administered in combination with transferred adoptive T cells, only the PS-targeting combination achieved these results without any off-target toxicities. In contrast, the anti-OX40 treatment combination triggered off-target side effects.
PS Exosome Technology Highlights:
The company continues to make progress with its PS exosome diagnostic technology that is designed to detect and monitor cancer. The assay has been successfully optimized and we are currently preparing to generate additional data by testing human samples. Such data will be important to partnering discussions.
Avid Bioservices Highlights
"FY 2017 was a strong year for Avid Bioservices with year-over-year revenue growth of 30% compared to FY 2016. The company recognized revenue of $17.9 million for the fourth quarter and $57.6 million for the full fiscal year," stated Paul Lytle, CFO of Peregrine. "While we missed our revenue guidance of $60-65 million, we were ready to ship a number of process validation runs which were delayed due to events outside our control. This delay has caused approximately $10 million in manufacturing revenue to shift from fiscal year 2017 to fiscal year 2018."
The company is providing manufacturing revenue guidance for the full FY 2018 of $50-55 million.
Avid's current manufacturing revenue backlog is $58 million, representing estimated future manufacturing revenue to be recognized under committed contracts. Most of the backlog is expected to be recognized during FY 2018.
Financial Highlights and Results
During the fourth quarter of FY 2017, we recorded total revenues of $17,904,000 as compared to $18,783,000 in the fourth quarter of the prior FY. For FY 2017, we achieved total revenues of $57,630,000 as compared to $44,686,000 for FY 2016. This represents total revenue growth of 29% for FY 2017 compared to the same prior year period.
Contract manufacturing revenue from Avid's clinical and commercial biomanufacturing services was $17,904,000 for the fourth quarter of FY 2017 compared to $18,783,000 for the fourth quarter of FY 2016. For the year, revenue increased 30% to $57,630,000 for FY 2017 compared to $44,357,000 for FY 2016. The fiscal year increase was primarily attributed to an increase in demand for contract manufacturing services associated with process validation activities. Current committed manufacturing backlog for Avid is approximately $58 million, covering services to be provided during FY 2018 and into FY 2019. Based on this current backlog, Peregrine expects contract manufacturing revenue for FY 2018 to be between $50 and $55 million.
Total costs and expenses for the fourth quarter of FY 2017 were $23,208,000, compared to $30,698,000 for the fourth quarter of FY 2016. For FY 2017, total costs and expenses were $85,890,000 compared to $101,046,000 for FY 2016. For the fourth quarter of FY 2017, research and development expenses decreased 59% to $6,717,000, compared to $16,265,000 for the fourth quarter of FY 2016. For FY 2017, research and development expenses decreased 52% to $28,297,000 compared to $59,529,000 for FY 2016.
Cost of contract manufacturing increased to $11,782,000 in the fourth quarter of FY 2017 compared to $9,721,000 for the fourth quarter of FY 2016, and to $38,259,000 for the full FY 2017 as compared to $22,966,000 for the full FY 2016. These increases are primarily due to an increase in the cost of contract manufacturing associated with higher reported revenue. Also contributing to this increase and impacting gross margins for the period is the higher overhead cost of operating the new Myford facility as well as higher labor cost associated with performing process validation runs combined with lower utilization of available capacity. For the fourth quarter of FY 2017, selling, general and administrative expenses decreased slightly to $4,709,000 compared to $4,712,000 for FY 2016. For FY 2017 selling, general and administrative expenses increased to $19,334,000 compared to $18,551,000 for FY 2016. The full-year increase is primarily due to the company's growing manufacturing business.
Peregrine's consolidated net loss attributable to common stockholders was $6,714,000 or $0.16 per share, for the fourth quarter of FY 2017, compared to a net loss attributable to common stockholders of $13,264,000, or $0.40 per share, for the same prior year quarter. For FY 2017, net loss attributable to common stockholders was $32,799,000, or $0.88 per share, compared to $60,136,000, or $1.95 per share, for FY 2016.
Peregrine reported $46,799,000 in cash and cash equivalents as of April 30, 2017, compared to $61,412,000 at fiscal year ended April 30, 2016.
More detailed financial information and analysis may be found in Peregrine's Annual Report on Form 10-K, which will be filed with the Securities and Exchange Commission today. [ http://tinyurl.com/ycxu4l5n ]
CONFERENCE CALL
Peregrine will host a conference call and webcast this afternoon, July 14, 2017, at 4:30 PM EDT (1:30 PM PDT). To listen to the conference call, please dial (877) 312-5443 or (253) 237-1126 and request the Peregrine Pharmaceuticals conference call. To listen to the live webcast, or access the archived webcast, please visit: http://ir.peregrineinc.com/events.cfm .
About Peregrine Pharmaceuticals, Inc.
Peregrine Pharmaceuticals, Inc. is a biopharmaceutical company committed to improving the lives of patients by delivering high quality pharmaceutical products through its contract development and manufacturing organization (CDMO) services and through advancing and licensing its investigational immunotherapy and related products. Peregrine's in-house CDMO services, including cGMP manufacturing and development capabilities, are provided through its wholly-owned subsidiary Avid Bioservices, Inc. ( http://www.avidbio.com ), which provides development and biomanufacturing services for both Peregrine and third-party customers. The company is also working to evaluate its lead immunotherapy candidate, bavituximab, in combination with immune stimulating therapies for the treatment of various cancers, and developing its proprietary exosome technology for the detection and monitoring of cancer. For more information, please visit http://www.peregrineinc.com .
About Avid Bioservices
Avid Bioservices provides a comprehensive range of process development, high quality cGMP clinical and commercial manufacturing services for the biotechnology and biopharmaceutical industries. With over 15 years of experience producing monoclonal antibodies and recombinant proteins in batch, fed-batch and perfusion modes, Avid's services include cGMP clinical and commercial product manufacturing, purification, bulk packaging, stability testing and regulatory strategy, submission and support. The company also provides a variety of process development activities, including cell line development and optimization, cell culture and feed optimization, analytical methods development and product characterization. For more information about Avid, please visit http://www.avidbio.com .
PEREGRINE PHARMACEUTICALS, INC.
CONSOLIDATED STATEMENTS OF OPERATIONS AND COMPREHENSIVE LOSS
THREE MONTHS ENDED
APRIL 30, TWELVE MONTHS ENDED
APRIL 30,
2017 2016 2017 2016
Unaudited Unaudited
REVENUES:
Contract manufacturing revenue $ 17,904,000 $ 18,783,000 $ 57,630,000 $ 44,357,000
License revenue — — — 329,000
Total revenues 17,904,000 18,783,000 57,630,000 44,686,000
COSTS AND EXPENSES:
Cost of contract manufacturing 11,782,000 9,721,000 38,259,000 22,966,000
Research and development 6,717,000 16,265,000 28,297,000 59,529,000
Selling, general and administrative 4,709,000 4,712,000 19,334,000 18,551,000
Total costs and expenses 23,208,000 30,698,000 85,890,000 101,046,000
LOSS FROM OPERATIONS (5,304,000 ) (11,915,000 ) (28,260,000 ) (56,360,000 )
OTHER INCOME (EXPENSE):
Interest and other income 37,000 31,000 108,000 722,000
Interest and other expense (5,000 ) — (7,000 ) (14,000 )
NET LOSS $(5,272,000) $ (11,884,000 ) $ (28,159,000 ) $ (55,652,000 )
COMPREHENSIVE LOSS $ (5,272,000 ) $ (11,884,000 ) $ (28,159,000 ) $ (55,652,000 )
Series E preferred stock accumulated dividends (1,442,000 ) (1,380,000 ) (4,640,000 ) (4,484,000 )
NET LOSS ATTRIBUTABLE TO COMMON STOCKHOLDERS $ (6,714,000
) $ (13,264,000 ) $ (32,799,000 ) $ (60,136,000)
WEIGHTED AVERAGE COMMON SHARES OUTSTANDING:
Basic and Diluted (1) 42,141,720 33,478,863 37,109,493 30,895,089
BASIC AND DILUTED LOSS PER COMMON SHARE (1) $ (0.16 ) $ (0.40 ) $ (0.88 ) $ (1.95 )
(1) All share and per share amounts of our common stock issued and outstanding for all periods have been retroactively adjusted to reflect the one-for-seven reverse stock split which took effect with the opening of trading on July 10, 2017.
PEREGRINE PHARMACEUTICALS, INC.
CONSOLIDATED BALANCE SHEETS
AS OF APRIL 30, 2017 AND 2016
2017 2016
ASSETS
CURRENT ASSETS:
Cash and cash equivalents $ 46,799,000 $ 61,412,000
Trade and other receivables 7,742,000 2,859,000
Inventories 33,099,000 16,186,000
Prepaid expenses 1,460,000 1,351,000
Total current assets 89,100,000 81,808,000
PROPERTY AND EQUIPMENT:
Leasehold improvements 20,098,000 19,610,000
Laboratory equipment 10,777,000 10,257,000
Furniture, fixtures, office equipment and software 4,499,000 4,045,000
35,374,000 33,912,000
Less accumulated depreciation and amortization (11,700,000 ) (9,610,000 )
Property and equipment, net 23,674,000 24,302,000
Restricted cash 1,150,000 600,000
Other assets 4,188,000 2,333,000
TOTAL ASSETS $ 118,112,000 $ 109,043,000
PEREGRINE PHARMACEUTICALS, INC.
CONSOLIDATED BALANCE SHEETS
AS OF APRIL 30, 2017 AND 2016 (continued)
2017 2016
LIABILITIES AND STOCKHOLDERS' EQUITY
CURRENT LIABILITIES:
Accounts payable $ 5,779,000 $ 8,429,000
Accrued clinical trial and related fees 4,558,000 7,594,000
Accrued payroll and related costs 6,084,000 5,821,000
Deferred revenue 28,500,000 10,030,000
Customer deposits 17,017,000 24,212,000
Other current liabilities 993,000 1,488,000
Total current liabilities 62,931,000 57,574,000
Deferred rent, less current portion 1,599,000 1,395,000
Commitments and contingencies
STOCKHOLDERS' EQUITY (1):
Preferred stock - $.001 par value; authorized 5,000,000 shares;
issued and outstanding - 1,647,760 and 1,577,440, respectively 2,000 2,000
Common stock - $.001 par value; authorized 500,000,000
shares; issued and outstanding - 44,014,040 and 33,847,213,
respectively 44,000 34,000
Additional paid-in-capital 590,971,000 559,314,000
Accumulated deficit (537,435,000 ) (509,276,000 )
Total stockholders' equity 53,582,000 50,074,000
TOTAL LIABILITIES AND STOCKHOLDERS' EQUITY $ 118,112,000 $ 109,043,000
(1) All share and per share amounts of our common stock issued and outstanding for all periods have been retroactively adjusted to reflect the one-for-seven reverse stock split which took effect with the opening of trading on July 10, 2017.
Safe Harbor *snip*
CONTACTS:
• Stephanie Diaz (Investors) Vida Strategic Partners 415-675-7401 sdiaz@vidasp.com
• Tim Brons (Media) Vida Strategic Partners 415-675-7402 tbrons@vidasp.com
- - - - - - - - -
From 10-Q header: “As of Jul. 10, 2017, there were 45,069,188 shares outstanding.”
- - - - - - - - - - - - - - - - -
Latest 10K 4-30-17 iss. 7-14-17 http://tinyurl.com/ycxu4l5n PR: http://tinyurl.com/yb4wulvu (Cash 4-30-17=$46.8mm)
Latest 10Q 1-31-17 iss. 3-13-17 http://tinyurl.com/zlozrv4 PR: http://tinyurl.com/grhwjvy (Cash 1-31-17=$41.5mm)
ALL SEC filings for PPHM: http://tinyurl.com/6d4jw8
7-14-17: O/S Shares & ATM Sales History (’06–curr.) http://tinyurl.com/yagmu2on
**NOTES:
1. PPHM shares were 1:7 Reverse Split eff. 7-10-17 (~315mm/$.606=>~45mm/$4.24) http://tinyurl.com/ycohqn6j
2. Per the 4-30-17 10-K, ALL ATM Agreements have been fully used – none remain. http://tinyurl.com/ycxu4l5n (F-20 & F-28)
= = = = = = = = = = = = = = = = = = = = = = = = = = = =
Updated PPHM REVS-BY-QTR TABLE, now thru FY17'Q4(fye 4-30-17), per the 10-K ( http://tinyurl.com/ycxu4l5n ) issued 7-14-17.
• Total Revs since May’06: ($231.2mm/Avid + $24.1mm/Govt + $2.5mm/Lic.) = $257.8mm
• 7-14-17: FY'18 (May'17-Apr'18) Avid revs guidance $50-55mm (committed B/L=$58mm). **
• Deferred-Revs at 4-30-17 total $28.5mm, UP from $26.4mm at 1-31-17.
• Cust.Deposits at 4-40-17 total $17.0mm, DOWN from $26.2mm at 1-31-17.
• Inventories at 4-30-17 total $33.1mm, DOWN from $33.8mm at 1-31-17.
• Avid’s Gross-Profit over last 4 qtrs: $19.4mm on revs of $57.6mm (GP%=34%)
• Recall, Avid Rev$ from Gov’t DTRA Contract work (6/30/08 – 4/15/11, totaling $24.15mm), went into GOVT-REVS, not AVID-REVS, in the Financials.
**4-30-17 10K/p.33: “Excluding any future potential new business, we expect Avid revs for FY18 to slightly decline vs. FY17. Part of this decline is due to lower anticipated commitments from Halozyme (our largest customer) based on their most recent committed forecast (covering the 3 qtrs ending March 2018), which amount is expected to be partially offset by $10mm revenue that was expected to be recognized in FY17, but has been shifted to FY18 due to a delay in shipping product that was complete and ready for shipment as of fye 4-30-17. http://tinyurl.com/ycxu4l5n
Avid’s website: http://www.avidbio.com
 AVID PROFITABILITY (GROSS*) BY QTR:
 QTR              Avid-Rev$  CostofMfg$  Gross-Profit$   GP%
 FY13Q1  7-31-12  4,135,000   2,024,000      2,111,000   51%
 FY13Q2 10-31-12  6,061,000   3,703,000      2,358,000   39%
 FY13Q3  1-31-13  6,961,000   3,651,000      3,310,000   47%
 FY13Q4  4-30-13  4,176,000   3,217,000        959,000   23%
 FY14Q1  7-31-13  4,581,000   2,670,000      1,911,000   42%
 FY14Q2 10-31-13  7,354,000   4,195,000      3,159,000   43%
 FY14Q3  1-31-14  3,885,000   2,416,000      1,469,000   38%
 FY14Q4  4-30-14  6,474,000   3,829,000      2,645,000   41%
 FY15Q1  7-31-14  5,496,000   3,583,000      1,913,000   35%
 FY15Q2 10-31-14  6,263,000   4,139,000      2,124,000   34%
 FY15Q3  1-31-15  5,677,000   3,113,000      2,564,000   45%
 FY15Q4  4-30-15  9,308,000   4,758,000      4,550,000   49%
 FY16Q1  7-31-15  9,379,000   4,608,000      4,771,000   51%
 FY16Q2 10-31-15  9,523,000   4,741,000      4,782,000   50%
 FY16Q3  1-31-16  6,672,000   3,896,000      2,776,000   42%
 FY16Q4  4-30-16 18,783,000   9,721,000      9,062,000   48%
 FY17Q1  7-31-16  5,609,000   3,062,000      2,547,000   45%
 FY17Q2 10-31-16 23,370,000  15,441,000      7,929,000   34%
 FY17Q3  1-31-17 10,747,000   7,974,000      2,773,000   26%
 FY17Q4  4-30-17 17,904,000  11,782,000      6,122,000   34%

 FY13 TOTAL:     21,333,000  12,595,000      8,738,000   41%*
 FY14 TOTAL:     22,294,000  13,110,000      9,184,000   41%*
 FY15 TOTAL:     26,744,000  15,393,000     11,151,000   42%*
 FY16 TOTAL:     44,357,000  22,966,000     21,391,000   48%*
 FY17 TOTAL:     57,630,000  38,259,000     19,371,000   34%*
 *Avid Net-Profit (ie, incl. Selling, G&A) not split out from PPHM-Corp. in the financials.
 .
 PPHM REVENUES (in thousands)              DEFERRED
                  -------REVENUES-------   REVENUES  INVEN-
 Quarter          Avid  Govt Lic.  TOTAL  Avid Govt  TORIES
 FY07Q1  7-31-06   398     0   23    421   317    0    971
 FY07Q2 10-31-06   636     0   48    684  1388    0   1899
 FY07Q3  1-31-07   347     0   16    363  2202    0   1325
 FY07Q4  4-30-07  2111     0  129   2240  1060    0   1916
 FY08Q1  7-31-07  1621     0    4   1625  1820    0   2363
 FY08Q2 10-31-07  1863     0   29   1892  1338    0   3500
 FY08Q3  1-31-08  1662     0   13   1675  1434    0   2394
 FY08Q4  4-30-08   751     0  150    901  2196    0   2900
 FY09Q1  7-31-08  1193   324    0   1517  4021  980   4628
 FY09Q2 10-31-08   983   958    0   1941  6472 1701   6700
 FY09Q3  1-31-09  5778  1048    0   6826  4805 3262   5547
 FY09Q4  4-30-09  5009  2683  175   7867  3776 3871   4707
 FY10Q1  7-31-09  2070  4671    9   6750  5755 2332   6177
 FY10Q2 10-31-09  5308  1510   78   6896  4260 3989   5850
 FY10Q3  1-31-10  2945  6854   78   9877  3052   76   3861
 FY10Q4  4-30-10  2881  1461   78   4420  2406   78   3123
 FY11Q1  7-31-10   983  2111  115   3209  3719   47   4692
 FY11Q2 10-31-10  3627   966   78   4671  2447   35   3555
 FY11Q3  1-31-11  1922   882   79   2883  4300   40   3915
 FY11Q4  4-30-11  1970   681   78   2729  5617    0   5284
 FY12Q1  7-31-11  5439     0  216   5655  4145    0   4481
 FY12Q2 10-31-11  4154     0   78   4232  2012    0   3178
 FY12Q3  1-31-12  3203     0   78   3281  2552    0   2722
 FY12Q4  4-30-12  1987     0   78   2065  3651    0   3611
 FY13Q1  7-31-12  4135     0  116   4251  6056    0   5744
 FY13Q2 10-31-12  6061     0   78   6139  6221    0   5426
 FY13Q3 1-31-13   6961     0   78   7039  5061    0   4635
 FY13Q4 4-30-13   4176     0   78   4254  4171    0   4339
 FY14Q1 7-31-13   4581     0  107   4688  4164    0   5679
 FY14Q2 10-31-13  7354     0    0   7354  3468    0   4033
 FY14Q3  1-31-14  3885     0    0   3885  4329    0   5224
 FY14Q4  4-30-14  6474     0    0   6474  5241    0   5530
 FY15Q1  7-31-14  5496     0    0   5496  4670    0   5998
 FY15Q2 10-31-14  6263     0   37   6300  3612    0   5379
 FY15Q3  1-31-15  5677     0    0   5677  5752    0   6148
 FY15Q4  4-30-15  9308     0    0   9308  6630    0   6148
 FY16Q1  7-31-15  9379     0  292   9671  8291    0  10457
 FY16Q2 10-31-15  9523     0    0   9523  9688    0  12554
 FY16Q3  1-31-16  6672     0   37   6709 15418    0  15189
 FY16Q4  4-30-16 18783     0    0  18783 15418    0  15189
 FY17Q1  7-31-16  5609     0    0   5609 21531    0  25274
 FY17Q2 10-31-16 23370     0    0  23370 21531    0  25274
 FY17Q3  1-31-17 10747     0    0  10747 26367    0  33829
 FY17Q4  4-30-17 17904     0    0  17904 28500    0  33099
 Totals:        231199 24149 2453 257801 <=since5/1/2006
 .
 TOTAL REV’s BY YEAR (Avid+Gov’t+Lic):
 FY04 4-30-04  3,314 …Avid(CMO)= 3,039 (Avid-Revs don’t incl. Govt-SVCS)
 FY05 4-30-05  4,959 …Avid(CMO)= 4,684
 FY06 4-30-06  3,193 …Avid(CMO)= 3,005
 FY07 4-30-07  3,708 …Avid(CMO)= 3,492
 FY08 4-30-08  6,093 …Avid(CMO)= 5,897
 FY09 4-30-09 18,151 …Avid(CMO)= 12,963
 FY10 4-30-10 27,943 …Avid(CMO)= 13,204
 FY11 4-30-11 13,492 …Avid(CMO)= 8,502
 FY12 4-30-12 15,233 …Avid(CMO)= 14,783
 FY13 4-30-13 21,683 …Avid(CMO)= 21,333
 FY14 4-30-14 22,401 …Avid(CMO)= 22,294
 FY15 4-30-15 26,781 …Avid(CMO)= 26,744
 FY16 4-30-16 44,686 …Avid(CMO)= 44,357
 FY17 4-30-17 57,630 …Avid(CMO)= 57,630
 ...Total Gov’t Revs from 7-2008 inception thru FY11Q1(Apr’11): $24.15mm
 .
 PPHM’S QTLY. NET LOSS BY QTR:
 FY08Q1  7-31-07 4,656,000
 FY08Q2 10-31-07 6,207,000
 FY08Q3  1-31-08 6,154,000
 FY08Q4  4-30-08 6,159,000
 FY09Q1  7-31-08 5,086,000
 FY09Q2 10-31-08 4,497,000
 FY09Q3  1-31-09 3,332,000
 FY09Q4  4-30-09 3,609,000
 FY10Q1  7-31-09 2,428,000
 FY10Q2 10-31-09 2,787,000
 FY10Q3  1-31-10 1,538,000
 FY10Q4  4-30-10 7,741,000
 FY11Q1  7-31-10 7,695,000
 FY11Q2 10-31-10 7,513,000
 FY11Q3  1-31-11 8,929,000
 FY11Q4  4-30-11 10,014,000
 FY12Q1  7-31-11 8,092,000
 FY12Q2 10-31-11 12,055,000
 FY12Q3  1-31-12 11,090,000
 FY12Q4  4-30-12 10,882,000
 FY13Q1  7-31-12 7,664,000
 FY13Q2 10-31-12 8,753,000
 FY13Q3  1-31-13 4,914,000
 FY13Q4  4-30-13 8,449,000
 FY14Q1  7-31-13 7,600,000
 FY14Q2 10-31-13 7,790,000
 FY14Q3  1-31-14 9,724,000
 FY14Q4  4-30-14 10,248,000
 FY15Q1  7-31-14 13,129,000
 FY15Q2 10-31-14 12,100,000
 FY15Q3  1-31-15 12,994,000
 FY15Q4  4-30-15 12,135,000
 FY16Q1  7-31-15 13,723,000
 FY16Q2 10-31-15 13,198,000
 FY16Q3  1-31-16 16,847,000
 FY16Q4  4-30-16 11,884,000
 FY17Q1  7-31-16 11,057,000
 FY17Q2  10-31-16 4,056,000
 FY17Q3   1-31-17 7,774,000
 FY17Q4   4-30-17 5,272,000

 = = = = = = = =
 OPER. CASH BURNS* BY QTR(FROM THE 10-Q/K’S):
 FY10Q1  7-31-09  2,024,000 (from 10Q pg.25)
 FY10Q2 10-31-09  2,351,000 (Q1+Q2: 4,375,000 pg.28)
 FY10Q3  1-31-10  1,158,000 (Q1+Q2+Q3: 5,533,000 pg.30)
 FY10Q4  4-30-10  6,375,000 (FY’10: 11,908,000 10K pg.58)
 FY11Q1  7-31-10  6,567,000 (from 10Q pg.24)
 FY11Q2 10-31-10  6,167,000 (Q1+Q2: $12,734,000 pg.25)
 FY11Q3  1-31-11  7,736,000 (Q1+Q2+Q3: $20,470,000 pg.26)
 FY11Q4  4-30-11  8,961,000 (FY’11: 29,431,000 10K pg.54)
 FY12Q1  7-31-11  6,984,000 (from 10Q pg.25)
 FY12Q2 10-31-11 11,668,000 (Q1+Q2: 18,652,000 pg.25)
 FY12Q3  1-31-12  8,490,000 (Q1+Q2+Q3: 27,142,000 pg.25)
 FY12Q4  4-30-12 11,265,000 (FY’12: 38,407,000 10K pg.55)
 FY13Q1  7-31-12  6,742,000 (from 10Q pg.21)
 FY13Q2 10-31-12  6,162,000 (Q1+Q2: 12,904,000 pg.23)
 FY13Q3  1-31-13  3,597,000 (Q1+Q2+Q3: 16,501,000 pg.23)
 FY13Q4  4-30-13  7,053,000 (FY’13: 23,554,000 10K pg.60)
 FY14Q1  7-31-13  5,750,000 (from 10Q pg.23)
 FY14Q2 10-31-13  5,834,000 (Q1+Q2: 11,584,000 10Q pg.24)
 FY14Q3  1-31-14  7,875,000 (Q1+Q2+Q3: 19,459,000 10Q pg.26)
 FY14Q4  4-30-14  8,706,000 (FY’14: 28,165,000 10K pg.55)
 FY15Q1  7-31-14 11,076,000 (from 10Q pg.23)
 FY15Q2 10-31-14  9,947,000 (Q1+Q2: 21,023,000 10Q pg.25)
 FY15Q3  1-31-15 11,116,000 (Q1+Q2+Q3: 32,139,000 10Q pg.26)
 FY15Q4  4-30-15 10,474,000 (FY’15: 42,613,000 10K pg.54)
 FY16Q1  7-31-15 12,306,000 (from 10Q pg.25)
 FY16Q2 10-31-15 11,701,000 (Q1+Q2: 24,007,000 10Q pg.26)
 FY16Q3  1-31-16 15,086,000 (Q1+Q2+Q3: 39,093,000 10Q pg.27)
 FY16Q4  4-30-16 10,112,000 (FY'16: 49,205,000 10K pg.39)
 FY17Q1  7-31-16 9,607,000 (from 10Q pg.22)
 FY17Q2 10-31-16 2,565,000 (Q1+Q2: 12,172,000 10Q pg.24)
 FY17Q3  1-31-17 6,274,000 (Q1+Q2+Q3: 18,446,000 10Q pg.24)
 FY17Q4  4-30-17 3,886,000 (FY'17: 22,332,000 10K pg.40)

 FY’09 total Op-Burn: $14,715,000
 FY’10 total Op-Burn: $11,908,000
 FY’11 total Op-Burn: $29,431,000
 FY’12 total Op-Burn: $38,407,000
 FY’13 total Op-Burn: $23,554,000
 FY’14 total Op-Burn: $28,165,000
 FY’15 total Op-Burn: $42,613,000
 FY’16 total Op-Burn: $49,205,000
 FY’17 total Op-Burn: $22,332,000
*The 10-Q’s define OPER.BURN as, ”Net cash used in operating activities before chgs. in operating assets & liabilities”.
The 7-21-2001 10Q explains OP.BURN very nicely:
“RESULTS OF OPERATIONS. Before we discuss the Company's total expenses (cash & non-cash expenses), we would like to discuss the Company's operational burn rate (cash expenses used in operations, net of interest and other income) for q/e July 31, 2001 compared to the same period in the prior year. The operational burn rate is calculated by taking the net income (loss) from operations and subtracting all non-cash items, such as the recognition of deferred license revenue, depreciation and amortization and stock-based compensation expense.”
 Period        Halozyme  Cust-A   Other-Custs
 FYE  4-30-14     91%       1%        8%
 FYE  4-30-15     79%      12%        9%
 FYE  4-30-16     69%      26%        5%
 Q/E  7-31-16     65%      29%        6%
 Q/E 10-31-16     77%      10%       13%
 Q/E  1-31-17     29%      56%       15%
 FYE  4-30-17     58%      26%       16%
- - - - - - - - PPHM’s Fiscal Qtr’s (FY runs May – April):
FY’10-Q3 = q/e 1-31-10 – rep. 3-11-10 Thu (B4 mkt)
FY’10-Q4 = q/e 4-30-10 – rep. 7-14-10 Wed (after mkt)
FY’11-Q1 = q/e 7-31-10 – rep. 9-9-10 Thu (after mkt)
FY’11-Q2 = q/e 10-31-10 – rep. 12-9-10 Thu (after mkt)
FY’11-Q3 = q/e 1-31-10 – rep. 3-11-11 Fri (after mkt)
FY’11-Q4 = q/e 4-30-11 – rep. 7-14-11 Thu (after mkt)
FY’12-Q1 = q/e 7-31-11 – rep. 9-9-11 Fri (B4 mkt)
FY’12-Q2 = q/e 10-31-11 – rep. 12-12-11 Mon (after mkt)
FY’12-Q3 = q/e 1-31-12 – rep. 3-9-12 Fri (after mkt)
FY’12-Q4 = q/e 4-30-12 – rep. 7-16-12 Mon (after mkt)
FY’13-Q1 = q/e 7-31-12 – rep. 9-10-12 Mon (B4 mkt)
FY’13-Q2 = q/e 10-31-12 – rep. 12-10-12 Mon (after mkt)
FY’13-Q3 = q/e 1-31-13 – rep. 3-12-13 Tue (after mkt)
FY’13-Q4 = q/e 4-30-13 – rep. 7-11-13 Thu (after mkt)
FY’14-Q1 = q/e 7-31-13 – rep. 9-9-13 Mon (after mkt)
FY’14-Q2 = q/e 10-31-13 – rep. 12-10-13 Tue (after mkt)
FY’14-Q3 = q/e 1-31-14 – rep. 3-7-14 Fri (B4 mkt)
FY’14-Q4 = q/e 4-30-14 – rep. 7-14-14 Mon (after mkt)
FY’15-Q1 = q/e 7-31-14 – rep. 9-9-14 Tue (after mkt)
FY’15-Q2 = q/e 10-31-14 – rep. 12-10-14 Wed (after mkt)
FY’15-Q3 = q/e 1-31-15 – rep. 3-12-15 Thu (after mkt)
FY’15-Q4 = q/e 4-30-15 – rep. 7-14-15 Tue (after mkt)
FY’16-Q1 = q/e 7-31-15 – rep. 9-9-15 Wed (after mkt)
FY’16-Q2 = q/e 10-31-15 – rep. 12-10-15 Thu (after mkt)
FY’16-Q3 = q/e 1-31-16 – rep. 3-9-16 Wed (B4 mkt)
FY’16-Q4 = q/e 4-30-16 – rep. 7-14-16 Thu (after mkt)
FY’17-Q1 = q/e 7-31-16 – rep. 9-8-16 Thu (after mkt)
FY’17-Q2 = q/e 10-31-16 – rep. 12-12-16 Mon (after mkt)
FY’17-Q3 = q/e 1-31-17 – rep. 3-13-17 Mon (after mkt)
FY’17-Q4 = q/e 4-30-17 – rep. 7-14-17 Fri (after mkt)
= = = = = = = = = = = =
“Going Concern” statement ELIMINATED from 4-30-13 10-K issued 7-11-2013…
2012: 4-30-12 10-K iss. 7-16-12 http://tinyurl.com/79o57b2
Pg.68: “As more fully described in Note 2, the Company’s recurring losses from operations and recurring negative cash flows from operating activities raise substantial doubt about its ability to continue as a going concern.”
2013 & 2014 & 2015 10-K's: http://tinyurl.com/p58jcbw etc...=> ((((NO GOING CONCERN STATEMENT INCLUDED.))))
CASH a/o 4-30-13: $35.2mm
CASH a/o 6-30-13: $42.6mm
CASH a/o 7-31-13: $41.6mm
CASH a/o 10-31-13: $44.4mm
CASH a/o 1-31-14: $63.2mm
CASH a/o 2-15-14: $79.7mm
CASH a/o 4-30-14: $77.5mm
CASH a/o 6-30-14: $78.3mm
CASH a/o 7-31-14: $73.3mm
CASH a/o 10-31-14: $64.4mm
CASH a/o 1-31-15: $55.2mm
CASH a/o 4-30-15: $68.0mm
CASH a/o 7-31-15: $59.0mm
CASH a/o 10-31-15: $72.0mm
CASH a/o 1-31-16: $67.5mm
CASH a/o 4-30-16: $61.4mm
CASH a/o 7-31-16: $44.2mm
CASH a/o 10-31-16: $49.5mm
CASH a/o 1-31-17: $41.5mm
CASH a/o 4-30-17: $46.8mm
= = = = = = = = = = A look at #Employees per the 10K’s…
2011 10-K: "As of 4-30-11, we employed 154 full-time emps & 2 part-time emps”
2012 10-K: "As of 4-30-12, we employed 172 full-time emps & 2 part-time emps."
2013 10-K: "As of 4-30-13, we employed 182 full-time emps & 5 part-time emps."
2014 10-K: "As of 4-30-14, we employed 180 full-time emps & 4 part-time emps."
2015 10-K: "As of 4-30-15, we employed 211 full-time emps & 4 part-time emps."
2016 10-K: "As of 4-30-16, we employed 281 full-time emps & 3 part-time emps."
2017 10-K: "As of 4-30-17, we employed 319 full-time emps & 4 part-time emps."

Recent CDMO News
- Avid Bioservices Announces Receipt of Deficiency Notice from Nasdaq Regarding Late Form 10-Q • GlobeNewswire Inc. • 03/20/2024 11:00:10 AM
- Form 8-K - Current report • Edgar (US Regulatory) • 03/07/2024 11:30:11 AM
- Avid Bioservices Announces Pricing of Private Placement of Convertible Notes • GlobeNewswire Inc. • 03/07/2024 04:58:48 AM
- Avid Bioservices Announces Proposed Private Placement of Convertible Notes • GlobeNewswire Inc. • 03/06/2024 09:32:07 PM
- Avid Bioservices Announces Certain Preliminary Financial Results for Third Quarter Ended January 31, 2024 • GlobeNewswire Inc. • 03/06/2024 09:31:28 PM
- Form 8-K - Current report • Edgar (US Regulatory) • 03/06/2024 09:30:18 PM
- Form SC 13G/A - Statement of acquisition of beneficial ownership by individuals: [Amend] • Edgar (US Regulatory) • 01/26/2024 09:57:52 PM
- Form 4 - Statement of changes in beneficial ownership of securities • Edgar (US Regulatory) • 01/13/2024 12:34:35 AM
- Form 4 - Statement of changes in beneficial ownership of securities • Edgar (US Regulatory) • 01/12/2024 12:39:18 AM
- Form 4 - Statement of changes in beneficial ownership of securities • Edgar (US Regulatory) • 01/12/2024 12:38:30 AM
- Form 4 - Statement of changes in beneficial ownership of securities • Edgar (US Regulatory) • 01/12/2024 12:37:38 AM
- Form 4 - Statement of changes in beneficial ownership of securities • Edgar (US Regulatory) • 01/12/2024 12:36:27 AM
- Form 4 - Statement of changes in beneficial ownership of securities • Edgar (US Regulatory) • 01/12/2024 12:35:47 AM
- Form 4 - Statement of changes in beneficial ownership of securities • Edgar (US Regulatory) • 01/11/2024 12:56:02 AM
- Form SC 13G/A - Statement of acquisition of beneficial ownership by individuals: [Amend] • Edgar (US Regulatory) • 01/08/2024 09:32:36 PM
- Form 4 - Statement of changes in beneficial ownership of securities • Edgar (US Regulatory) • 01/04/2024 12:56:18 AM
- Form 4 - Statement of changes in beneficial ownership of securities • Edgar (US Regulatory) • 01/04/2024 12:55:07 AM
- Form 4 - Statement of changes in beneficial ownership of securities • Edgar (US Regulatory) • 01/04/2024 12:53:58 AM
- Form 4 - Statement of changes in beneficial ownership of securities • Edgar (US Regulatory) • 01/04/2024 12:51:57 AM
- Form SC 13G - Statement of acquisition of beneficial ownership by individuals • Edgar (US Regulatory) • 12/19/2023 09:05:52 PM
- Form 4 - Statement of changes in beneficial ownership of securities • Edgar (US Regulatory) • 12/19/2023 12:34:08 AM
- Form 4 - Statement of changes in beneficial ownership of securities • Edgar (US Regulatory) • 12/19/2023 12:33:03 AM
- Form 4 - Statement of changes in beneficial ownership of securities • Edgar (US Regulatory) • 12/19/2023 12:32:11 AM
- Form 4 - Statement of changes in beneficial ownership of securities • Edgar (US Regulatory) • 12/19/2023 12:31:12 AM
FEATURED Glucotrack Announces Expansion of Its Continuous Glucose Monitoring Technology to Epidural Glucose Monitoring • Apr 17, 2024 8:00 AM
ILUS Provides Form 10-K Filing Update • ILUS • Apr 17, 2024 9:54 AM
Maybacks Global Entertainment To Fire Up 24 New Stations in Louisiana • AHRO • Apr 16, 2024 1:30 PM
Cannabix Technologies Begins Certification of Contactless Alcohol Breathalyzer, Re-Brands product series to Breath Logix • BLOZF • Apr 16, 2024 8:52 AM
Kona Gold Beverages, Inc. Acquires Surge Distribution LLC from Loud Beverage Group, Inc. (LBEV) • KGKG • Apr 16, 2024 8:30 AM
Branded Legacy, Inc. Reports Significant Net Income of Over $3.8 Million • BLEG • Apr 16, 2024 8:30 AM

