Market tracking typical July pattern for now By Almanac Trader | July 13, 2017
DJIA closed at a new all-time high once again today. But, before we go celebrating a great deal, DJIA closed a mere 3.15 points above its previous all-time high close on June 19. In percentage terms it works out to a meager 0.015% gain in just over three weeks. S&P 500, NASDAQ, Russell 1000 and Russell 2000 did not participate in the new all-time high party today. If they did, or do soon, this would be encouraging.
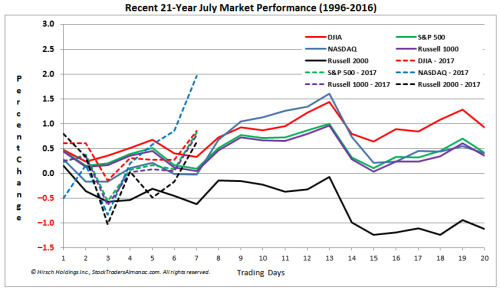
Based upon July’s recent 21-year performance chart, there are potentially six more trading days for the other major indices to catch up to DJIA. However, the typical mid-July rally has begun a few days earlier than usual, there may only be until the end of this week for the major indices to confirm a possible DJIA break out. NASDAQ’s midyear rally comes to an end on the ninth trading day which is July 14 so tech could fizzle soon thereafter.
Information posted to this board is not meant to suggest any specific action, but to point out the technical signs that can help our readers make their own specific decisions. Your Due Dilegence is a must! • DiscoverGold
Register for free to join our community of investors and share your ideas. You will also get access to streaming quotes, interactive charts, trades, portfolio, live options flow and more tools.


 News
News  Market Data
  Discover