


Sunday, July 02, 2017 4:41:31 PM
Yesterday I discussed the conflicting conventional TA signals, some saying continued down and others reversal, and that last time we got in this range we had a magical reversal. I broke the impasse with my unconventional stuff and said { ... I'm thinking near-term continuing weakening is most likely. }
Well, that was wrong and furthermore everything today suggests near-term strengthening as most likely.
Today was a very low-volume day almost all day. Trade did the usual open high, hit the low by 9:41, recovered about half the drop by 10:00ish, and did a long flat period through almost 12:00. That was followed by a brief drop and quick recovery to set a new intra-day high at 12:25 on a 22K minute and then do a wide spread flattish through 15:41. After that we got the common push high, but unusually on high volume, into the close, setting another intra-day high at 15:49 before giving back about half that gain to close at $0.6701.
There were no pre-market trades.
B/a just before open was 800:900 $0.61/$0.75.
09:30-10:00 opened the day with a 1,034 buy for $0.6720 & $0.66 x 20, x 2. B/a just after open was 100:98 $0.64/5 (offers backed by presented $0.6720 x 37, $0.6740 x 200). Then came 9:39's 200 $0.66/5, 9:40's 1.2K $0.6410 (800)/05/00/$0.6304, 9:41's 2.7K $0.6300/$0.6255 (100)/$0.6486 (100), 9:43's 100 $0.65, 9:49's b/a 200:100 $0.6301/$0.65, 9:51's 4K $0.6302, 10:00's b/a 21:100 $0.6302/$0.65 (bids backed by presented 300 $0.6301). The period ended on 10:00's 100 $0.6468.
10:01-11:44 began extremely low/no-volume (e.g. 10:01-:15's no-trades), $0.6498/$0.65 on 10:16's 100 $0.65. B/a at 10:17 was 6:100 $0.6302/$0.65 (bids backed by presented 1.5K $0.6301), 10:32 1K:200 $0.6375/$0.65, 10:42 1.4K:200 $0.6375/$0.65. Volume and price were interrupted by 10:44's 2.5K $0.6500/2 and 10:45's 1.2K $0.646/$0.6508. B/a at 11:02 was 200:4.6K $0.64/$0.6520. Highs moved to $0.6520 on 11:05's 100 $0.6520. B/a at 11:19 was 2.2K:1.5K $0.6401/$0.65, 11:29 2.2K:1.5K $0.6401/$0.65. The period ended on 11:44's 200 $0.65.
11:45-12:22 during the initial fifteen no-trades minutes had b/a at 11:47 of 200:4.5K $0.6403/$0.6520. Trade began extremely low/no-volume $0.64/5 on 12:00's 1.1K $0.6403/00 (900). B/a at 12:02 was 310:471 $0.6398/$0.65, 12:17 95:71 $0.64/5 (b/a backed by presented bids 10 $0.6395, 1K $0.6375, offers 4.5K $0.6520). The period ended on 12:22's 100 $0.65.
12:23-14:57 began extremely low/no-volume $0.6501/$0.67 after 12:24's 2.8K $0.6500 (1.2K)/10 (1.1K)/20/00 and 12:25's 22.5K $0.6520 (4.3K)/01 (600)/$0.68 (11.9K)/$0.6644 (2.5K)/99 (490)/$0.6572/$0.6644/$0.6501 (2.2K). B/a at 12:35 was 900:5.8K $0.65/$0.67, 12:47 900:5.5K $0.65/7, 13:02 900:5.5K $0.65/7, 13:36 200:5.3K $0.6502/$0.67, 14:06 200:5K $0.6503/$0.67, 14:17 300:4K $0.6503/$0.67, 14:32 300:4K $0.6503/$0.67, 14:47 400:4.7K $0.6503/$0.67. The period ended on 14:57's 130 $0.6522.
14:58-15:37, after eight no-trades minutes, began extremely low/no-volume $0.6604/$0.67 after 15:05's 7K $0.6699 (6K)/02 (1K). B/a at 15:02 was 300:4.7K $0.6503/$0.67, 15:18 1.1K:4.6K $0.6503/$0.67, 15:32 4.9K:4.5K $0.6604/$0.67. The period ended on 15:37's 100 $0.67.
15:38-15:49, after two no-trades minutes, began the oh-so-common push up into the close, on mostly high-volume with some low-volume, on 15:40's 18.7K $0.6605 (18K incl 15.6K blk)/34. 15:42's 15.9K hit $0.6634 (3.3K)/$0.6501/$0.67 (4.4K)/$0.6598/$0.67/$0.6501/$0.6800 (5.8K)/12/00 (1K)/01 (1K) and the period ended when 15:49's 6.3K hit $0.6800 (2K)/09/08/00/20 (3.1K)/01/$0.69.
15:50-15:59 began giving back all the gains on 15:50's 896 $0.69 and hit 15:52's 23.9K $0.6900 (20.9K)/$0.6701 (3K). The rest of the period was a low-volume sag of the lows going from $0.67/$0.6802 to 15:59's 1.1K $0.6627/$0.6702 (700)/1, making the official close 15:59's 200 $0.6701 because the was no MM 16:00 closing trade.
There were no AH trades.
Excluding the opening and closing trades (didn't qualify), there were 8 larger trades (>=5K & 3 4K+) totaling 62,522, 45.22% of day's volume, with a $0.6728 VWAP. For the volume, the count seems in a normal range and the percentage of day's volume is a bit to the high side of normal. The VWAP is well above the day's VWAP of $0.6674. Note below how "clumped" they are in the last one hour and few minutes and accounting for a really hefty portion of the day's volume during that period. Looking below at the short percentage and factoring in the percentage of larger trades I think the shorting must have been much heavier than the short percentage would suggest. We have a couple certain "larger larger trades" and some others that likely were such. If these went of "behind the curtain" as inter/intra-broker trades, as is common, they would generate few short flags.
Factoring in the buy percentage behavior intra-day I suspect we had either some bullish retailers taking this volume or shorters doing covering buys at very attractive prices. Given general market sentiment I lean toward the latter as being most likely.
Movements of VWAPs and buy percentages were well correlated today. I can fathom no reason for the intra-day buy percentage and VWAP behaviors except that shorters may be covering at attractive prices, locking in profits. I'll never know.Ending Period Period Period __Per. Trade_ Period_ % Day_ Per. End
Period Volume Low High _Dollar Val._ VWAP___ Volume Buy ~%
10:00 9383 $0.6255 $0.6720 $5,979.19 $0.6372 6.79% 17.54% Incl 09:51 $0.6302 4,000
11:44 10659 $0.6460 $0.6520 $6,934.84 $0.6506 7.71% 60.72%
12:22 1700 $0.6400 $0.6500 $1,094.06 $0.6436 1.23% 58.79%
14:57 31965 $0.6500 $0.6800 $21,289.66 $0.6660 23.12% 69.81% Incl 12:25 $0.6800 11,894
15:37 8600 $0.6602 $0.6700 $5,739.68 $0.6674 6.22% 70.48% Incl 15:05 $0.6699 6,000
15:59 74528 $0.6501 $0.6900 $50,281.39 $0.6747 53.90% 56.33% Incl 15:40 $0.6605 15,625 15:42 $0.6700 4,423
15:42 $0.6800 4,580
15:52 $0.6900 8,000 8,000
On the traditional TA front, movements were:
Yesterday I said { ... suggests the down leg is still in progress and gaining strength. One thing that argues against that is seen on the minimal chart - last time down at this level a leg up magically appeared, presumably as a result of Cowan & Co. successfully moving the market to support ATM sales. There was probably some PR involved with part of it though. Sans a PR I don't know we could count on the re-appearance of that. } Well, well, well. Another magical reversal? Don't know. I do know the ATM has been in use and strongly suspect the market has been managed by Cowan & Co. to support ATM use. My guess here would be just another case of that going on. We certainly have no trend suggesting any change in sentiment to bullish fro apathetic (at best) or bearish. The latest short interest report suggests that just a few weeks back sentiment was strongly bearish and I've not seen anything suggesting a change in that should have occurred.__Open_ ___Low_ __High_ _Close_ Volume_
Today -0.59% 0.08% 2.07% 5.11% -26.81%
Prior 0.90% -3.85% -2.03% -1.92% 50.23%
On my minimal chart, yesterday I said { ... range and close were below the top support line confirming a break below support back into the descending channel. The rising volume would suggest gaining strength in the move down, but as mentioned above a leg up magically appeared last time we were in this range. I wouldn't rule out a re-occurrence of that behavior. }
Well, today is looking sort of familiar isn't it? For no apparent reason, catalyst PR or TA (unless the experimental 13-period Bollinger band lower limit is sufficient, which hasn't been the case in the past) a leg up, but on reduced volume (you know what that means, right?) apparently is trying to begin. The high penetrated the descending channel's (descending blue lines) and was rejected, closing below both the line and the open. Regardless of that and the volume, note that last time the leg up from the lower range began it was also on reduced volume.
Th fast EMA, $0.6054, stopped falling and now is only about a penny-and-a-half below the still-falling slow EMA, $0.6754.
N.B. Yesterday I had a brain glitch and erroneously said { It's been below since 4/19. At some point it's got to reverse, right? Right now no sign of that happening though. } In fact, the fast EMA was above the slow 6/5-6/20, about two trading weeks.
On my one-year chart, today's trade was no longer completely below the falling 10-day's $0.6912 (was $0.6917) and the falling 50-day SMA's $0.6865 (was $0.6891). Today topped barely above, and traded mostly below, the 10, 50 and the now-rising 20-day SMA at $0.6786 (was $0.6761).
It still appears the 20-day SMA will cross below the 50-day in just a day or two but now the 10-day dropped below the 50.
If the leg up that seems to be trying to start succeeds we don't need to worry about that though.
Yesterday the oscillators I watch had weakening in accumulation/distribution, RSI, MFI (untrusted by me) and ADX-related. Improvement occurred in momentum, Williams %R (still oversold) and full stochastic (exited oversold, barely). Everything is below neutral.
Today had improvement in accumulation/distribution, RSI, momentum, Williams %R (exited oversold), full stochastic and ADX-related. Weakening occurred in MFI (entered oversold and untrusted by me).
The experimental 13-period Bollinger limits, $0.6217 and $0.7628 ($0.6237 and $0.7629 yesterday), continued diverging with yesterday's slightly falling mid-point continuing to slightly decline.
All in, yesterday I noted { ... improvement in some of the oscillators suggest a turn might be coming while the rising volume on lower high, low and close suggest the opposite. Bearishness is also suggested by the falling SMAs, with the 20 below the 50 and the 10 about to cross below. } I then went on to say { If we could count on what happened last time we were in this range (mentioned above) we would swing to bullish. I don't think it's safe to rely on that though. We could also look at the bounce off the lower Bollinger limit early in the day a conclude that might be bullish. I guess the tie-breaker will be the intra-day breakdown above.
With the buy percentages for all the periods being so low, I think the most likely near-term movement is further weakening. }
That last clause was a BIG FAIL as today only the open and volume were lower and the oscillators and intra-day breakdown have switched to now strongly suggesting near-term upside is most likely.
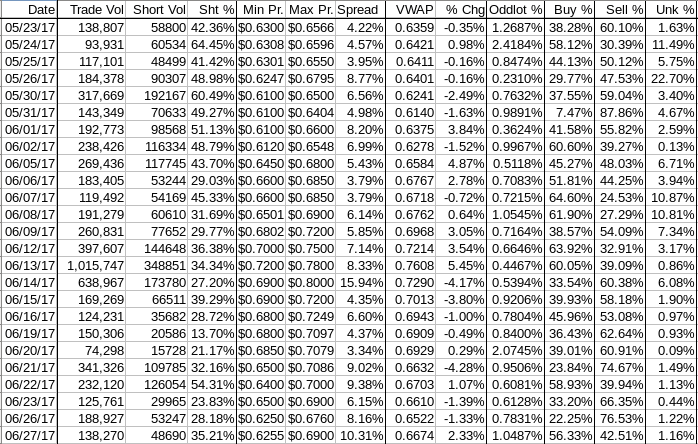
Percentages for daily short sales and buys moved in the same direction, a good thing, and, even better, the short percentage is right at the low end of my desired range (needs re-check) while the buy percentage has is up to suggesting near-term upside as most likely.
The spread continued to widen and combined with the two percentages just mentioned supports near-term upside as the most likely direction.
The VWAP stopped weakening and improved, moving us from only two positives in nine days to three positives in ten days.
The VWAP's rolling average of the last twenty-four movements, after holding steady at 14 negatives and 10 positives for two consecutive days, improved to 13 negatives and 11 positives. Change since 05/23 is $0.0314, 4.94%, and the averages of the rolling 24-day period seen in the last few days (latest first) are now 0.2367%, 0.1251%, 0.1050%, 0.2012%, 0.0999%, 0.2079%, 0.2379%, 0.2486%, 0.2622%, 0.5035%.
All in, we have a complete flip to everything here suggests near-term strengthening from yesterday's { everything here suggests near-term continued weakening. }
Bill
Join the InvestorsHub Community
Register for free to join our community of investors and share your ideas. You will also get access to streaming quotes, interactive charts, trades, portfolio, live options flow and more tools.

