


Wednesday, June 21, 2017 8:39:27 AM
All things point to near-term consolidation with a mild weakening bias. No suggestion of bullishness exists. Having said that, if the manipulation to support $CPSTs raising cash through the ATM continues there could be some appreciation. I don't expect Cowan & Co. can overcome the negativism that has began to manifest though and they will have to sell at slowly weakening prices.
Today was a big drop through about 10:00, a sideways through ~11:50 and then a bump up to go sideways again through about 14:45. The common bump up then occurred to go flattish into the close.
There were no pre-market trades.
B/a just before open was 500:400 $0.6510/$0.7780.
09:30-09:46 opened the day with a 5,940 sell for $0.71 & $0.71 x 213, x 1.5K. B/a just after open was 37:800 $0.71/2 (bids backed by presented 550 $0.7055). Then came a 9:31's b/a 550:363 $0.7055/99, 9:32's 114 $0.7055, 9:33's 100 $0.7055, 9:34's b/a 4.6K:1.9K $0.7000/98, 9:34's 1K $0.7050, 9:35's 1.2K $0.7001/11 (150), 9:36's 6.2K $0.7011 (563)/00 (563)/07/08/00 (1.4K)/01 (600)/01 (1.2K), 9:37's 250 $0.7097, 9:38's b/a 8K:900 $0.7010/98 (bids rising), 9:40's 908 $0.7011, 9:41's 7.5K $0.7010 (7.4K)/16, 9:44's 3.9K $0.7010 (1.6K)/00 (2.1K)/$0.6906 (200), 9:45's 100 $0.70. The period ended on 9:46's 750 $0.69.
9:47-11:41 began highly variable volume $0.6900/83, with rapidly falling highs and slowly rising lows, on 9:48's 150 $0.6911. B/a at 9:49 was 793:1.2K $0.6901/$0.70, 10:05 500:1K $0.6971/81. At 10:12 volume switched to extremely low/no-volume $0.6910/79. B/a at 10:14 was 1.4K:900 $0.6911/81. Volume was interrupted by 10:47's 4.7K $ 0.6930 (200)/25 (3.8K)/14 (700). B/a at 10:47 was 400:2.8K $0.6916/30, 11:03 400:200 $0.6915/26. Volume was interrupted by 11:05-:07's 18.3K $0.6917/27 (2K)/16 (1.4K)/30 (2.3K), $0.6919 (1K)/20 (1K)/23 (4K), $0.6917 (800)/16 (5.2K. There were no trades 11:08-:17. B/a at 11:11 was 2.5K:900 $0.6916/78, 11:32 5K:500 $0.6910/1. The period ended on 11:41's 300 $0.6911.
11:42-12:51, after two no-trades minutes, began extremely low/no-volume $0.6975/$0.70 on 11:44's 2.5K $0.6999. B/a at 11:47 was 200:1.8K $0.6920/99. Volume was interrupted by 11:56's 1.8K $0.6975/$0.70. B/a at 12:02 was 200:950 $0.6920/$0.72, 12:17 100:800 $0.70/2, 12:32 1.6K:950 $0.70/2. Volume was interrupted by 12:44's 7.3K $0.70 and 12:47's 10.3K $0.696/70. B/a at 12:47 was 300:4.7K $0.6920/$0.70. The period ended on 12:51's 6.4K $0.6998 (1.8K)/99 (300)/$0.70.
12:52-14:37, after six no-trades minutes, began extremely low/no-volume $0.70/$0.7101 ??:?? on 12:58's 100 $0.7101. B/a at 13:02 was 100:900 $0.70/2, 13:17 10.1K:150 $0.70/2, 13:42 11.1K:150 $0.70/2, 14:02 1.6K:150 $0.7001/$0.72, 14:17 300:150 $0.7003/$0.72, 14:32 10K:180 $0.71/$0.7230. The period ended on 14:37's 121 $0.71.
14:38-15:59, after twenty-one no-trades minutes, began extremely low/no-volume $0.7100/65, with falling highs, on 14:59's 100 $0.7165. B/a at 14:47 was 10.1K:180 $0.71/$0.7230, 15:02 10.1K:180 $0.71/$0.7230, 15:17 800:2.2K $0.7101/64, 15:32 1.7K:2.8K $0.7101/64, 15:47 700:1.2K $0.7105/29 (bids falling), 15:58 2K:100 $0.7100/4, and the period and day ended on 15:59's 200 $0.7103/4 and the official close was 15:59's last $0.7104 x 100 because there was no MM 16:00 closing trade.
There were no AH trades.
Excluding the opening and closing trades (didn't qualify), there were 10 larger trades (>=5K & 2 4K+) totaling 73,664, 43.52% of day's volume, with a $0.7061 VWAP. For the day's volume the count seems reasonable and the percentage of day's volume is only a little to the high side. The VWAP is noticeably above the day's $0.7013, making me surmise that we had more retail investors present today. I could be wrong - there's also shorters doing covering buys and/or MMs doing the same. As with yesterday I would think shorters would not yet be doing covering buys. If the ATM was being used, which I would suspect is the case with these higher recent prices, I would guess Cowan & Co. took advantage of some folks.
The connection between buy percentage and VWAP was weak early but seemed to be more consistent later on. Regardless of that, the buy percentage was not strong anywhere during the day and makes me wonder if the ATM was being used again. Peeking below I do see the short percentage was up a bit, into the middle of my desired range, so maybe not. That could be due to short-term traders selling though if the shares they were selling had not yet settled.Ending Period Period Period __Per. Trade_ Period_ % Day_ Per. End
Period Volume Low High _Dollar Val._ VWAP___ Volume Buy ~%
09:46 29360 $0.6900 $0.7100 $20,640.81 $0.7030 17.35% 17.31% Incl 09:30 $0.7100 5,940 09:41 $0.7010 6,400
11:41 63877 $0.6900 $0.6983 $44,230.86 $0.6924 37.74% 28.86% Incl 09:56 $0.6900 9,200 11:06 $0.6923 4,000
11:07 $0.6916 5,200
12:51 28641 $0.6960 $0.7099 $20,045.66 $0.6999 16.92% 35.08% Incl 12:44 $0.7000 4,990 12:47 6,550
14:37 33388 $0.7000 $0.7200 $23,862.94 $0.7147 19.72% 42.96% Incl 13:50 $0.7200 6,200 17,200
16:00 12459 $0.6930 $0.7165 $8,846.99 $0.7101 7.36% 39.93% Incl 15:48 $0.7100 7,984
On the traditional TA front, movements were:
Well, this confirms what we saw yesterday - the market is apparently not enthused by the results reported, at least not enough to combat shorters and/or ATM activity. I guess we needn't wait for any three-day window to end before we start looking for the new trend.__Open_ ___Low_ __High_ _Close_ Volume_
Today -11.25% 0.00% -10.00% -1.31% -73.51%
Prior 7.79% -4.17% 2.56% -7.12% -37.09%
On my minimal chart the most notable thing is that the trading range was was completely at/below the declining fast EMA's $0.7198, but for 2/100ths of a penny. The good news is the slow EMA, $0.6907, is still rising and trading range was barely below it. Can one take hope from this? Nah! I expect the fast EMA will make a cross below the slow EMA soon. That's a pretty bearish signal if it does happen.
Another (temporary?) piece of potential positive is that the trading range was about 75% above the $0.70 resistance and the close of $0.7104 was still above it. It doesn't look all that positive though when we look at later stuff below.
At last we are not "pushing" the experimental 13-period Bollinger band upper limit. The mid-point, $0.6778, is still below our trading range though, so I expect we'll continue lower for a bit longer.
The best news is that volume dropped substantially and is low enough that we can believe that the strength in the move lower is about to start to weaken.
One last piece of potential positive is that the descending channel (descending blue lines) that price was in 5/9-6/8 is just below the trade range. Conventional TA says that the upper line should offer support, for at least a little while. Keep your fingers crossed, kiss your rabbit's foot and wear your lucky charms.
On my one-year chart, through yesterday, for the fourth consecutive day, we had traded completely above the rising 10 and 20-day SMAs and trading range was about 80% above the 50-day SMA and closed above the 50-day's $0.7075. Today's trade dipped below the rising 10-day SMA and was more or less centered on the 50-day's $0.7065 and closed just above it at $0.7104. Unfortunately, the 50-day SMA has continued the decline begun yesterday. The 10 and 20-day are still rising, so there is hope that the price decline will begin to slow but other indications are that it will not do so immediately.
Yesterday the oscillators I watch had weakening in every oscillator I watch. Of the ones in overbought, only MFI (untrusted by me) remains so. Accumulation/distribution and ADX-related are below neutral while all others are still above neutral.
Today had improvement in accumulation/distribution and weakening in all others. Below neutral are accumulation/distribution and ADX-related. All others are still above neutral. Nothing is overbought or oversold.
The experimental 13-period Bollinger limits, $0.5872 and $0.7694 ($0.5836 and $0.7627 yesterday),
The volume again fell compared to yesterday but it's no longer high enough to suggest strength in a move lower. This suggests some stabilization but with the other items' readings I do expect some mild continuing weakness.
All in, it's looking like we might enter a short-sterm consolidation, with a mild weakening bias.
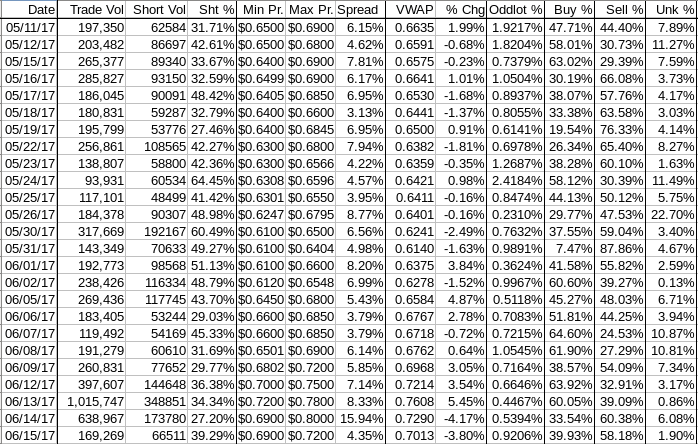
Percentages for daily short sales and buys moved in the same direction, good, and short percentage is about in the middle of my desired range (needs re-check). Buy percentage is below what's needed to suggest holding steady and is suggesting near-term weakening as most likely.
The spread contracted to near-consolidation levels, also suggesting entering a short-term consolidation.
VWAP fell for the second consecutive day.
The VWAP's rolling average of the last twenty-four movements, after holding steady for the two consecutive days at 13 negatives and 11 positives, deteriorated to 14 and 10 respectively. Change since 05/11 is $0.0378, 5.69%, and the averages of the rolling 24-day period seen in the last few days (latest first) are now 0.2622%, 0.5035%, 0.6348%, 0.3385%,0.1182% and -0.0514%, -0.2146%, -0.2079%, -0.3689%, and -0.6415%.
All in, no suggestion of near-term appreciation. Consolidation is suggested with a mild negative bias.
Bill
Join the InvestorsHub Community
Register for free to join our community of investors and share your ideas. You will also get access to streaming quotes, interactive charts, trades, portfolio, live options flow and more tools.

