


Monday, May 22, 2017 6:50:35 AM
I'm still thinking we are in consolidation but in the process of exiting it with a sag lower. There are conflicts within conventional TA and within my unconventional stuff too. I resolved these by looking at longer-term (relatively) trends.
Factoring in that tomorrow is a Friday, quite often a low-volume flattish day, I don't expect any big move but minor wobbles up or down could certainly be seen.
Another typical open high, go higher to $0.6599 by 9:37 and drop to $0.64 on 9:43's 30K minute. The difference from many other days was the range was quite narrow today. From then through 15:52 it was extremely low/no-volume, with the usual interspersed minute or two volume spikes, flattish $0.64/5 through 15:52, with rising lows and a lower high from about 13:50 onward. Then 15:53 came with high price volatility to try and close up, I presume to set up for the next day, but the best that was achieved was $0.66 with a close of $0.6538 on 15:59's last 100-share trade because there was no MM 16:00 closing trade.
I guess that's why the AH trade at 17:05 for 400 shares at $0.66 was done - to get the higher close relatively well above the $0.65 open so it would look bullish, sort of, on the conventional TA charts.
There were no pre-market trades.
09:30-10:13 opened the day with a 139 sell for $0.65 & $0.65 x 50. B/a just after open was 1.9K:3.3K $0.6500/99. Then came 9:35's 300 $0.65, 9:36's 100 $0.6599, 9:38's 1.8K $0.65, 9:43's 30K $0.6401/14/12/04/03/00 (27.8K incl 23.8K blk)/$0.6405, 9:45's 100 $0.6401, 9:48's 127 $0.6438, 9:50's b/a 8.4K:1084 $0.6400/89, 9:50's 2.5K $0.6400/89 (200), 9:51's 2.6K $0.6435 (1K)/89/35/81/35/89, 9:52's 1.1K $0.6400 (1K)/81, 10:02's 100 $0.6481, 10:04's b/a 600:5.1K $0.6401/99, 10:04's 100 $0.6477, 10:07's 300 $0.6470/50, 10:09's 200 $0.6470/99, 10:12's 100 $0.6481, and the period ended on 10:13's 5.5K $0.6401 (2K)/00 (3K)/99 (500).
10:14-10:43, after two no-trades minutes, began extremely low/no-volume $0.6482/$0.6499. B/a at 10:15 was 5K:6K $0.6400/98, 10:34 500:2.9K $0.6401/99. The period ended on 10:43's 500 $0.6495.
10:44-13:22 began extremely low/no-volume $0.6402/0.65, with very slowly rising lows, after 10:44-:46's 10.4K $0.6411/89/50, $0.6489/10 (1.5K)/01 (3.5K)/49 (1.4K) and $0.6449 (3.2K)/50/$0.65. B/a at 10:47 was 1K:4.5K $0.6401/99. Pecking the offers with 100 shares every couple minutes occurred 10:47-10:58 and 11:04-:13. B/a at 11:02 500:4.7K $0.6402/99, 11:17 600:1.1K $0.6402/99. 11:20-:27 did larger-volume intermittent minutes $0.6493/8 with many no-trades minutes between. B/a at 10:32 was 600:1.1K $0.6402/99. Volume was interrupted by 11:35's 16.9K $0.6415/02 (15.2K)/98/99 (1.1K). B/a at 11:38 was 800:4.8K $0.6402/1.4K $0.6402/99, 11:47 800:2.9K $0.6402/99. Volume was interrupted by 11:54's 3.9K $0.6421/20 (aggregate 3.5K)/ ... $0.65 (200). B/a at 12:02 was 300:3K $0.6419/97, 12:18 300:3K $0.6450/99, 12:33 500:100 $0.6422/98. Highs began slowly sagging and lows giving up the gains at 12:51. B/a at 12:53 was 700:1.8K $0.6480/98, 13:02 400:2.4K $0.6481/99, 13:17 200:1.5K $0.6430/53. The period ended on 13:22's 100 $0.6448.
13:23-15:52, after four no-trades minutes, began mostly extremely low/no-volume $0.64/5 on 13:27's 3.3K $0.6415/6/5. B/a at 13:32 was 100:1K $0.6422/99. Volume was interrupted by 13:46's 12.2K $0.6400 (8.3K)/15/13/64/09/32/00/09/01/00/$0.6500/$0.6400/08. B/a at 13:47 was 700:1.6K $0.6401/16. Volume was interrupted by 13:52's 8.7K $0.6420/99 (8.3K)/20. B/a at 13:58 was 900:2K $0.6401/90 (offers jiggling), 14:17 1K:400 $0.6401/15, 14:32 100:300 $0.6450/71. The lows began creeping slowly higher at 14:43. B/a at 14:47 was 300:400 $0.6430/49, 15:02 200:100 $0.6413/64, 15:17 500:300 $0.6413/42, 15:32 200:500 $0.6440/70, 15:47 500:100 $0.6472/4. The period ended on 15:52's 7K $0.6472/3.
15:53-15:59 began very low-volume, high price-volatility, doing $0.6472/$0.66, on 15:53's 500 $0.6473/$0.6536/$0.6472/$0.6567. The period and day ended on 15:59's 500 $0.6600/05/06/05/36 to give the official close of $0.6536 because 16:00 had no closing MM 16:00 trade. This minute included the closing 100 unknown $0.6536 & odd-lots, also not allowed to be anything official, of $0.66 x 48, $0.6401 x 97, $0.64 x 97, x 97.
There was one AH unknown $0.66 x 400 at 17:05. Although a bit earlier and larger than my normal suspect trades, being ~1% above the official close and at the days high with b/a at the time of $0.64/8 does raise my hackles. Let's see if tomorrow opens high.
Excluding the opening and closing trades (didn't qualify), there were 5 larger trades (>=5K) totaling 54,600, 30.19% of day's volume, with a $0.6415 VWAP. For the day's volume, the count seems OK, although a bit to the low side, and the percentage of day's volume is also OK but a bit to the high side due to the 09:43 $0.6400 23.8K block trade at the day's low price. The VWAP is below the day's $0.6441, with all but one of the larger trades being $0.6402 and lower. I presume the one 8K $0.6499 trade was a retail trader/investor and most of the others were likely MMs doing covering buys.
The buy percentage remains in dismal territory and the correlation of movements of buy percentage and VWAP is spotty. Some of this disparity is likely just a normal low-volume effect but I can't strongly rule out use of the ATM because of the history of apparent and suspected use regardless of price ranges.
 Ending  Period  Period  Period __Per. Trade_ Period_ % Day_ Per. End
 Period  Volume     Low    High _Dollar Val._ VWAP___ Volume Buy ~%
  10:13   44933 $0.6400 $0.6599    $28,806.25 $0.6411 24.85% 3.77% Incl 09:43 $0.6400 23,800
  10:43    6866 $0.6479 $0.6500     $4,459.68 $0.6495  3.80% 16.58%
  13:22   51206 $0.6401 $0.6500    $32,976.33 $0.6440 28.32% 29.97% Incl 11:35 $0.6402 5,800 9,400
  15:52   69781 $0.6400 $0.6500    $44,977.14 $0.6445 38.59% 34.24% Incl 13:46 $0.6400 7,600 13:52 $0.6499 8,000
  15:59    6200 $0.6472 $0.6600     $4,052.88 $0.6537  3.43% 33.38%
  17:05     400 $0.6600 $0.6600       $264.00 $0.6600  0.22% 33.29%
On the traditional TA front movements were:
Yesterday, at the top-of-post summary, I said { I'm now suspecting short-consolidation will shortly end and, switching strongly, now think we will not get a leg up, but rather an exit from consolidation with a leg down. } With the second consecutive day of declines in all but the close, the exit from consolidation is looking increasingly likely and a break below $0.64, which has been support for four days, seems quite likely as well. If the manipulation I suspect is real, it might take a while to get there though.__Open_ ___Low_ __High_ _Close_ Volume_
Today -5.11% -0.08% -3.65% 0.58% -2.80%
Prior -0.72% -1.45% -0.72% -1.55% -34.91%
On my minimal chart, after three days with the high at or above the short-term descending resistance (descending orange line), about $0.665 today, price did no better than approach it even with the manipulated opening minute and 9:36's 100-share $0.6599. Assuming other chartists see the same thing I see, we could trade, intra-day at least, above it again as the apparent $0.64 support is in place and that could give us another few days of sideways, which could put the high(s) at or above the line as it continues falling.
The slow EMA continued to decline, at a slightly faster rate now than the fast EMA, with the fast below the slow. Two days back the fast EMA had a one-day tick up, thanks to the marginally higher (and manipulated IMO) close. Yesterday day it gave it back and continued to do so today, ticking lower again. The gap from the slow down to the fast is now $0.0137 (was $0.0275). The rate of descent for the slow EMA was slowing marginally but has picked up steam today.
The high had hit the slow EMA for three consecutive day, as mentioned, due to typical early manipulations to set a high. Today it came nowhere near it's $0.6770.
Yesterday I noted apparent confirmation that the price manipulations were having less beneficial (to whom?) effect, based on what the price/volume combination was doing. Today volume was essentially flat (~5.2K lower) while price high was down significantly, $0.685 vs. $0.66, again making me think the price manipulations are ever more fruitless.
It looks like we are still in the short-term consolidation but my assessment yesterday was we would not remain so for long. Today's behavior does nothing to cause a change in the opinion. As mentioned yesterday, I have been converted and believe now the most likely near-term exit is on a leg down.
On my one-year chart, for the fourth consecutive day we did not trade completely below all SMAs, all of which are falling with them all in order, 10 < 20 < 50 < 200. Our (manipulated) high penetrated, for the fourth consecutive day, the falling 10-day SMA's $0.6578. Unfortunately, for the fourth day of trying to get above the 10-day SMA, we again closed below it at $0.6536.
Yesterday the oscillators I watch had weakening in every oscillator but full stochastic, which continued to rise further out of oversold. Everything remains below neutral and in oversold are RSI, MFI (untrusted by me) and Williams %R.
Today had improvement in accumulation/distribution, RSI (got just above oversold), MFI (still oversold and untrusted by me), momentum (still below neutral), Williams %R (still oversold), and full stochastic (still below neutral). ADX-related was, in aggregate flattish.
The experimental 13-period Bollinger limits, $0.6219 and $0.7159 ($0.6187 and $0.7309 yesterday), continued converging as the lower limit rises while the upper limit declines. The mid-point is falling due to the upper limit's rate of decline being higher than the lower limit's rate of rise.
All in, I have to resolve the conflict of conventional TA showing improvement in the oscillators while the price movement in context of the trends is looking negative. Factoring in the intra-day behavior and the intra-day breakdown leads me to remain more negative. My assessment is that while we may remain in a mostly sideways trend near-term, with some short-term improvement in the price range, likely due to manipulation, the movements of buy percentages and VWAPs intra-day will ultimately sag lower near-term.
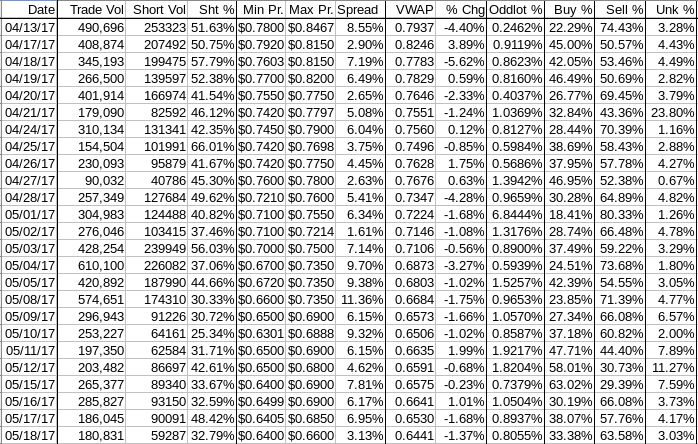
Percentages for daily short sales and buys moved in the same direction, lower, and the short percentage is only slightly below my desired range, a positive I think. The buy percentage conflicts with that though, being in a range for the third day that suggests near-term weakness is most likely. This is supported by the last 17 VWAP movements which are negative for 13 of those days..
The spread today conflicts with that as it contracted substantially, reaching a range that suggests consolidation with the possibility of minor movements in any direction, down. sideways or up. This is a break in the recent trend of 11 days of a wide spread, but one day doesn't make a new trend. We'll have to wait a see what unfolds.
The VWAP's rolling average of the last twenty-four movements held for for the fourth day at 17 negatives and 7 positives. Change since 04/13 is -$0.1496, -18.85%, and the averages of the rolling 24-day period seen in the last few days (latest first) are now -0.8471%, -0.9736%, -0.9789%, -0.8459%, -0.6735%, -0.6459%, -0.7513%, -0.5928%, -0.6491%, -0.4703%.
All in, I resolve the conflict between short and buy percentages with the VWAP trend, leading to a near-term negative bias. But the spread suggests no direction and allows for a near-term small positive bias. I'm going to remain near-term negative most likely while acknowledging that minor positive improvements, as allowed by the spread's current range, could appear. But beyond that I think we exit consolidation to the downside.
Bill
Join the InvestorsHub Community
Register for free to join our community of investors and share your ideas. You will also get access to streaming quotes, interactive charts, trades, portfolio, live options flow and more tools.

