


| Followers | 915 |
| Posts | 47978 |
| Boards Moderated | 0 |
| Alias Born | 07/22/2008 |
Wednesday, May 17, 2017 9:26:01 AM
Current PPS (price per share) = $0.0009
AS = 2,100,000,000
OS = 1,830,612,000
FLOAT = 1,670,612,000 (CEO and wife have 160,000,000 shares = the difference between OS and FLOAT)
Market Cap (DIGX Evaluation) = OS x Current PPS = $1,647,550
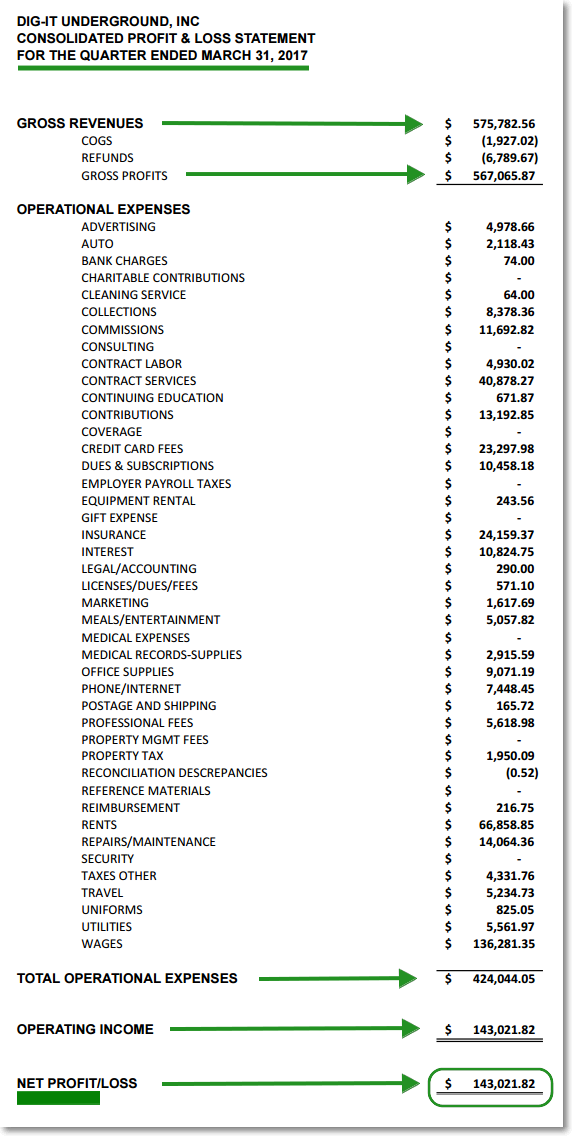
Q1 2017 Performance:
Gross Revenues = $575,783
Net Revenues = $567,066
Net Income (aka earnings or PROFIT) = $143,022
EPS = $0.000078 (earnings divided by OS, $143,022 / 1.83B)
That is the earnings per share for 1 quarter. To project these numbers over the whole year (4 quarters) we have to multiply our EPS (earnings per share) by 4. This assumes zero growth from Q1 to Q4, just Q1's performance times 4.
EPS for 2017 (full year projected) = $0.000312 ($0.000078 x 4)
Applying PE Ratios:
PE of 10 = EPS x 10 = $0.00312 <<< (TODAY'S TARGET!)
PE of 20 = EPS x 20 = $0.00624
PE of 30 = EPS x 30 = $0.00936
PE of 40 = EPS x 40 = $0.0125
PE of 50 = EPS x 50 = $0.0156
Current PPS (price per share) = $0.0009
DIGX Q1 03/31/2017 (filed Monday):
Link > DIGX Q1 03/31/2017
Coinllectibles' Subsidiary, Grand Town Development Limited, Acquires Rare Song Dynasty Ceramics Worth Over USD28million • COSG • Apr 18, 2024 8:03 AM
ILUS Provides Form 10-K Filing Update • ILUS • Apr 17, 2024 9:54 AM
Glucotrack Announces Expansion of Its Continuous Glucose Monitoring Technology to Epidural Glucose Monitoring • GCTK • Apr 17, 2024 8:00 AM
Maybacks Global Entertainment To Fire Up 24 New Stations in Louisiana • AHRO • Apr 16, 2024 1:30 PM
Cannabix Technologies Begins Certification of Contactless Alcohol Breathalyzer, Re-Brands product series to Breath Logix • BLOZF • Apr 16, 2024 8:52 AM
Kona Gold Beverages, Inc. Acquires Surge Distribution LLC from Loud Beverage Group, Inc. (LBEV) • KGKG • Apr 16, 2024 8:30 AM

