


Thursday, May 11, 2017 9:13:44 AM
Well, data slightly to the contrary, today I'm settling on entering consolidation with a mild negative bias.
However, I am frequently too early! Is this another case of that? Will too much patience be needed or will I be completely wrong? I don't know. Prudence would dictate waiting for some confirmation. Of course, some upside is lost but, maybe more importantly, a lot of downside may be avoided too.
Note that a five-minute period did 18%+ of the volume today. The VWAP of that period was below mid-range for the day. Somebody got serviced.
An unusual behavior today was a big dip lower in buy percentage was followed by a bigger than normal recovery as the day progressed. The dip was done by 10:45 and the recovery occurred as price moved up to $0.67 by 11:19. That defined the high for the rest of the day, which went through the normal down, flat, recover, ... but with a solid consistent trend of higher lows for the rest of the day, allowing us to close at $0.66 - erstwhile potential support.1s
That means conventional TA says there is no confirmed breakdown yet. This gives us a third touch of the line, which in conventional TA means it is a valid support now.
There were no pre-market trades.
B/a just before open was 100:100 $0.6301/$0.68.
09:30-10:04 opened the day with a 300 buy for $0.6888 & $0.65 x 166, x 172. B/a just after open was 6.3K:100 $0.6500/8. Then came 9:33's 100 $0.6520, 9:34's b/a 8.5K100 $0.65/8, 9:35's b/a 1.5K:100 $0.6520/$0.68, 9:36's 200 $0.6800/5, 9:37's 415 $0.6805/$0.6520, 9:38's 200 $0.6805, 9:39's 200 $0.6520, 9:40's 300 $0.6520, 9:41's 400 $0.6795/$0.6520, 9:42's 300 $0.6520, 9:43's b/a 1.2K:500 $0.6520/$0.6805, 9:43's 300 $0.6520, 9:44's 200 $0.6520, 9:45's 300 $0.6520, 9:46's 1.3K $0.6520/$0.6660 (170)/$0.6520, 9:47's 300 $0.6520/6, 9:48's 400 $0.6526/$0.6650/90/$0.6520, 9:49's 300 $0.6526/33, 9:49's b/a 300:1K $0.6520/$0.6690, 9:50's 200 $0.6533/$0.6690, 9:51's 200 $0.6533/$0.6690, 9:52's 3.2K $0.6533/$0.6690/$0.6540/$0.6605/80 (1.9K)/90, 9:53's 300 $0.6690/$0.6540/$0.6686, 9:54's 400 $0.6540/51/$0.6686/$0.6551, 9:55's 300 $0.6686/$0.6560, 9:56's 400 $0.6686/$0.6560/2/$0.6680, 9:57's 300 $0.6570/$0.6676/$0.6570, 9:57's b/a 300:600 $0.6520/$0.6690, 9:58's 300 $0.6572/$0.6660/$0.6572, 9:59's 400 $0.6658/$0.6542/30/$0.6658, 10:00's 400 $0.6534/3a/$0.6658/$0.6530, 10:01's 300 $0.6530/$0.6658/$0.6533, 10:02's 400 $0.6530/$0.6642/$0.6532, 10:03's 600 $0.66/$0.6533/35/$0.6660/$0.6543, and the period ended on 10:04's 1.5K $0.6335/$0.6646/$0.6550.
10:05-10:28 had b/a at 10:05 of 100:1.1K $0.6545/92 (offers dropping) during the five initial no-trades minutes. Trade began extremely low/no-volume $0.6511/$0.6540 on 10:10's 700 $0.6545/40. B/a at 10:12 was 6.6K:4.4K $0.6500/60, 10:17 4K:2.7K $0.6510/46 (offers falling). Volume was interrupted by 10:19's5.2K $0.6510/11 (1.3K)/00 (100). Pecking the bid, $0.65, with 200 shares/minute dominated 10:21-:28. B/a at 10:28 was 9.2K:1.9K $0.6500/4. The period ended on 10:28's 200 $0.6500/4.
10:29-10:33 did a rapid high-volume drop on 10:29's 15.2K $0.65/$0.6477/50 (5K)/$0.65 (100), 10:30's 100 $0.65, 10:31's 10.2K $0.6500/1/2/4/$0.6489, 10:32's 400 $0.645, and 10:33's 20.5K $0.64.
10:34-10:44 began very low-volume $0.6400/14 on 10:34's 583 $0.6456/10. B/a at 10:47 was 2K:1.2K $0.6301/$0.6450. The period ended on 10:44's 3K $0.6410/00 (100).
10:45-11:30 began an extremely low/no-volume clawing upward from $0.6301 after 10:45's 5.6K $0.64/$0.6301 (100). B/a at 10:53 was 8.3K:1.2K $0.6310/$0.6450. 10:55's 300 hit $0.6310/90 and 11:14's 2.6K hit $0.6351/$0.6450. B/a at 11:17 was 200:100 $0.6331/$0.6442. 11:19's 100 hit $0.67. B/a at 11:21 was 1.4K:300 $0.64/7. The period ended on 11:30's 300 $0.6671/$0.6401/$0.6551.
11:31-11:51 began an extremely low/no-volume consolidation, with rising lows and falling highs through 11:37, on 11:31's 100 $0.6685. B/a at 11:32 was 1.6K:1K $0.6401/$0.67. A short, steep decline began on 11:38's 19.4K 11:38's 19.4K $0.6550/$0.6400/14/05/01/15/55/15/$0.6400/07/00/$0.6507/05/$0.6401/00. The bottom was hit, and a climb back up began, on 11:43's 200 $0.6352. B/a at 11:47 was 800:200 $0.64/5. 11:47's 2.1K hit $0.64/$0.65/$0.6450. The period ended on 11:51's 200 $0.6426/$0.65.
11:52-12:37 began extremely low/no-volume $0.6416/50, with slowly rising lows, on 11:52's 4.9K $0.6446/26/46/50/49/45/26/43/04. B/a at 12:03 was 100:100 $0.6410/50, 12:17 100:500 $0.6422/50, 12:32 1.3K:100 $0.6412/50. The period ended on 12:37's 200 $0.6514/50.
12:38-13:26, beginning with b/a at 12:38 of 4.5K:1K $0.65/7, did a pop up on 12:38's 2.6K $0.6450/49/50/$0.65 and 12:39's 1.7K $0.6673/00/70/00. Trade then fell back on 12:42-:44's 8.3K $$0.6518/64/18/00/$0.6599/$0.66/$0.6599/96/99/00/25. That began extremely low/no-volume $0.6500/1. B/a at 12:47 was 4.3K:100 $0.6500/50. At 13:02 the range expanded to $0.6500/92 with declining highs. 13:02 2/5K:2.5K $0.6500/96 (offers falling), 13:17 1.8K:2.2K $0.6500/62. The period ended on 13:26's 1.2K $0.6521/54/00.
13:27-14:11 began extremely low/no-volume $0.66/7 after 13:27's 7K $0.6553/$0.6600/$0.6553/54/55/27/53/40 and 13:28's 2K $0.66/7/6. B/a at 13:32 was 4.8K:400 $0.66/7, 13:47 3.2K:3.3K $0.6600/99, 14:02 2.8K:3.5K $0.6600/97. The period ended on 14:11's 100 $0.6697.
14:12-16:00 began extremely low/no-volume $0.65/6 on 14:12's 4.9K $0.6600/1 (100)/0/$0.6595 (200)/00 (100). B/a at 14:14 was 700:700 $0.6500/27 (offers falling), 14:32 800:400 $0.65/$0.6670. Price was interrupted by 14:38-:39's 300 $0.6500/$0.6670. B/a at 14:47 was 900:5K $0.6500/$0.6630. The low moved up to $0.6550 at 14:54. B/a at 15:02 was 500:300 $0.6551/$0.6679, 15:17 400:300 $0.6551/$0.6679, 15:32 400:700 $0.6550/$0.6667, 15:47 400:200 $0.6560/$0.6667. The period and day ended on 15:59's 2K $0.67/$0.6570/$0.6600/35/$0.6570/$0.6635/$0.67/$0.6635/$0.67/$0.6570/$0.66/$0.6570/$0.6599 and 16:00's 100 $0.66.
There were no AH trades.
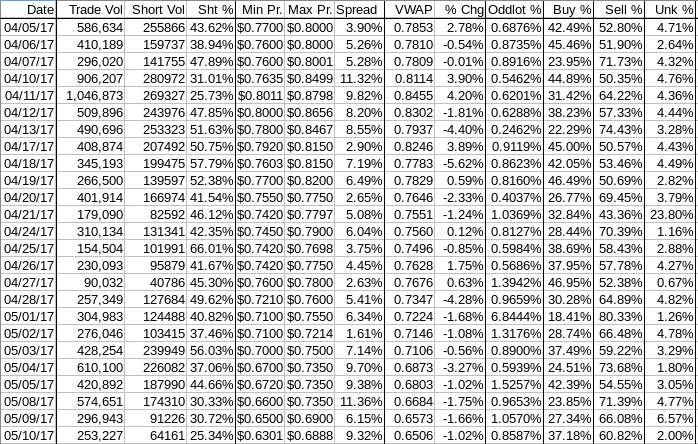
Excluding the opening and closing trades (didn't qualify), there were 10 larger trades (>=5K & 2 4K+) totaling 60,384, 23.85% of day's volume, with a $0.6463 VWAP. For the volume, the count seems reasonable and the percentage of day's volume seems in the normal range. The VWAP is well above the day's $0.6506, leading me to think we had mostly retail investors in today, likely lured by the drop below the prior all-time low price. Or maybe it was the stuff I noted yesterday, such as the oscillator being almost all in oversold territory combined with reducing volume.
We'll never know. We do know that the next couple of days will tell us if these were good purchases or not.
Speaking of that, note the unusual behaviors below. One was a five-minute period that accounted for 18%+ of the day's volume. The other is that buy percentage went into the dumpster early, as is common recently, but this time made a recover much stronger than normal. Again, I suspect it was due to retailers.
Another suspicion is that we didn't have any ATM activity after about 10:45. That's around the time price bottomed, after a long fall from the early higher price, and began a long general rise through around 13:30. From then on range was $0.65/7 at various times into the close.
Today has one of the more consistent connections between buy percentage and VWAP movements. Also, as mentioned above, we saw an unusually strong recovery in the buy percentage from abysmal lows. Buy percentage still ended low, but it was at a better level than I would have expected given how low buy percentage got and the recent behavior that made me think the ATM was in use.Ending Period Period Period __Per. Trade_ Period_ % Day_ Per. End
Period Volume Low High _Dollar Val._ VWAP___ Volume Buy ~%
10:04 15223 $0.6500 $0.6888 $10,044.57 $0.6598 6.01% 38.78%
10:28 10750 $0.6500 $0.6545 $6,997.42 $0.6509 4.25% 23.18%
10:33 46285 $0.6400 $0.6504 $29,854.60 $0.6450 18.28% 19.37% Incl 10:29 $0.6450 4,900 10:31 $0.6504 4,300
10:33 $0.6400 6,030 6,000
10:44 12150 $0.6400 $0.6455 $7,790.24 $0.6412 4.80% 17.09% Incl 10:36 $0.6410 7,900
11:30 25338 $0.6301 $0.6700 $16,272.06 $0.6422 10.01% 26.49% Incl 11:07 $0.6449 5,000
11:51 24020 $0.6332 $0.6685 $15,426.70 $0.6422 9.49% 23.71% Incl 11:38 $0.6400 10,754
12:37 19000 $0.6400 $0.6450 $12,235.09 $0.6440 7.50% 31.30% Incl 12:11 $0.6435 5,000
13:26 23941 $0.6449 $0.6673 $15,701.87 $0.6559 9.45% 33.50% Incl 12:42 $0.6664 5,500
14:11 16639 $0.6527 $0.6700 $10,989.63 $0.6605 6.57% 35.50%
16:00 57725 $0.6500 $0.6700 $38,036.40 $0.6589 22.80% 37.21% Incl 14:51 $0.6630 5,000
This is one reason I suspect no, or little, ATM use today. We observed sensitivity to price, which was notably absent on several occasions when I felt strongly the ATM was in use.
On the traditional TA front, movements were:
For the third day, the movements don't bode well, but we have volume continuing to decline, which does suggest the strength of the drop is lessening. This can be seen too in that all movements but the low are improved over the prior day's. The low may have been a sign of capitulation by some folks that had been trying to hang in or stop-loss triggers getting hit.__Open_ ___Low_ __High_ _Close_ Volume_
Today -0.17% -3.06% -0.17% 0.46% -14.72%
Prior -2.82% -1.52% -2.82% -1.35% -48.33%
On my minimal chart we continued the trend of trading below the short-term descending resistance (descending orange line), but in contrast to yesterday which had the high withdrawing from the descending line, today the high touched the line, thanks to the fact it's descending and a high-for-the-day open of $0.6888.
Price continued "pushing" the lower experimental 13-period Bollinger band limit for the ninth consecutive day. Trading range was again completely, and substantially, below the falling mid-point, $0.7131.
Both the fast and slow EMAs continue to decline with the fast below the slow. The gap from the slow down to the fast is now $0.0444 (was $0.0476). This is the first contraction of the gap in a while and it's due to the fast EMA's descent rate slowing.
Yesterday, I was discussing the prior day's thought we had more downside left, but thought it would be minimal and would enter a short consolidation based somewhere around that $0.66, plus or minus a bit. The results prompted me to say { b]So far that looks correct - we traded lower but the low was down only a penny, $0.66 to $0.65. If it is to remain correct we have to no [sic] begin a period of the low holding in around the current level, resulting in either a sideways move or beginning a reversal. }
Hm, using the low of $0.63, I think { have to ... begin a period of the low holding in around the current level ... } missed the mark. But looking at the close of $0.66 and the way it was produced - a general upward trend from the 10:44 intra-day low and a solid trend of rising lows from about 12:30 onward - along with a good improvement in buy percentage makes me think there's a real chance that the turn is beginning. I think tomorrow will give us a clue as to that.
I also said { The falling volume, although still a bit high, offers this possibility. It's really iffy though and I wouldn't bet my chips on it yet. }
The volume again declined today and is now low enough that I think it allows that we may have bottomed. If I was at the table I'd be pondering shoving a few chips into the pot for a short-term play. I would keep the bet small though as there's always the possibility that the ATM would come back into play.
On my one-year chart, for the ninth consecutive day, trading range was completely below all SMAs, all of which are falling with them all in order, 10 < 20 < 50 < 200. Looking at just this one could decide that patience on shoving the chips in was a better decision.
Yesterday the oscillators I watch had improvement only in momentum and Williams %R (still deeply oversold). Weakening occurred in everything else. Everything is below neutral and everything but MFI (untrusted by me) that has an oversold demarcation is oversold.
Today had improvement in accumulation/distribution (minimal), RSI, momentum, Williams %R (barely oversold now), and full stochastic (still oversold). Deterioration occurred in MFI (untrusted by me), which entered oversold, and ADX-related.
The experimental 13-period Bollinger limits, $0.6364 and $0.7889 ($0.6451 and $0.7978 yesterday), continued diverging as both limits declined, the lower faster than the upper. The mid-point is falling.
All in, positive suggestions exist in the intra-day behavior discussed above, the reducing volume and the change in oscillator behavior. Negatives exist in the SMA, continuation of making new intra-day lows and highs, and the still low buy percentage, although it showed better intra-day behavior, as discussed above.
This conflict in indications, especially going from "almost all negative almost all the time", is what I would expect to see when a turn was nearing sans a catalyst of some kind. That would get me thinking about adding some trading blocks.
However, I am frequently too early! Is this another case of that? Will too much patience be needed or will I be completely wrong? I don't know. Prudence would dictate waiting for some confirmation.
Percentages for daily short sales and buys moved in opposite directions, not the preferred relationship, and the short percentage dropped further below the desired range (needs re-check). The buy percentage, considered in light of the comments above about it's intra-day improvement, is at a level offering hope - not for immediate price improvement, but for the absence of continued ATM use and a return to normal buy percentage levels. This would then allow for price improvement.
The spread expanded and was produced by the common very high open and a 9.32% decline to $0.63 by 10:44. I would normally read this as a big negative but for the behavior of the intra-day buy percentage behavior discussed briefly above. With that consideration added in I'm not so sure this is a big negative indication. I'm leaning towards it indicating positive movement when normally within a down trend I would read it as suggesting more downside.
The VWAP's rolling average of the last twenty-four movements, after holding steady for two consecutive days at 16 negatives and 8 positives, deteriorated to 17 and 7 respectively. Change since 04/05 is -$0.1347, -17.15%, and the averages of the rolling 24-day period seen in the last few days (latest first) are now -0.7513%, -0.5928%, -0.6491%, -0.4703%, -0.5319%, -0.4198%, -0.2739%, -0.1888%, -0.1311%, and 0.1088%.
All in, in spite of my attempts to "adjust" what the data suggests, I'm remaining cautious until I can see some kind of optimism without having to "adjust" what is suggested. So for here I'll go with entering consolidation but still with a mild negative bias.
Bill
Join the InvestorsHub Community
Register for free to join our community of investors and share your ideas. You will also get access to streaming quotes, interactive charts, trades, portfolio, live options flow and more tools.

