Long And Short Of Short Interest By Hedgopia | May 10, 2017
Here is a brief review of period-over-period change in short interest in the April 17-28 period in the Nasdaq and NYSE Group as well as nine S&P 500 sectors.
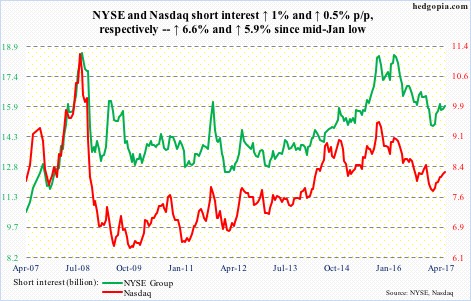
Nasdaq
The composite (6120.59) is up 1.2 percent May-to-date, and is on course for logging seven consecutive monthly gains – up just under 18 percent from October close.
From mid-November to mid-January, Nasdaq short interest dropped 7.6 percent before rising again, even as the index continued to rally to newer highs. Shorts are staying put. Bears smelling blood or misplaced conviction?
NYSE Group
The composite (11567.52) is yet to take out March 1 all-time high – essentially sideways for nearly three months, with some signs of fatigue and the 50-day moving average flattish. Shorts probably feel good.
In January, the index had a major break out of 11100-11200. On its way down, what happens around that resistance-turned-support likely decides if shorts cover or stay.
…
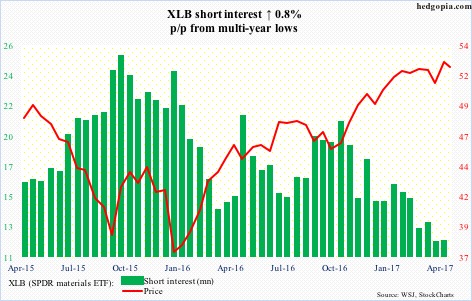
XLB (SPDR materials ETF)
XLB (52.65) broke out of two-year resistance last November. Shorts got squeezed in the subsequent rally.
The ETF is more or less sideways this year, caught between 51 and 53. Shorts act tentative. Their conviction will probably increase once the range breaks down.
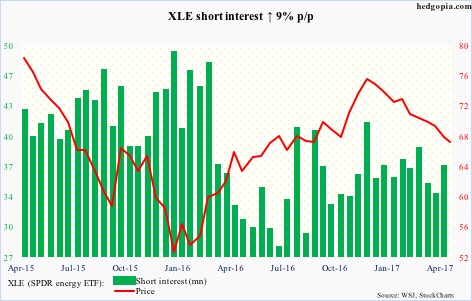
XLE (SPDR energy ETF)
XLE (67.23) is attempting to stabilize but the December 2016 declining trend line will only be broken around 68.50, which also approximates the falling 20-day. Both 50- and 200-day are above (69.33 and 70.31, respectively).
Shorts continue to maintain decent size position.
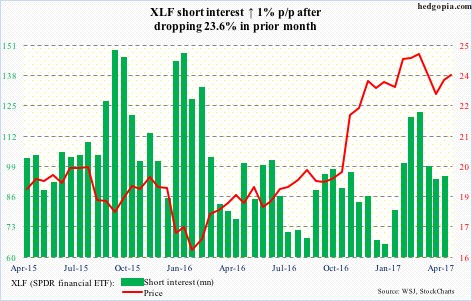
XLF (SPDR financial ETF)
XLF (23.73) had a major break out of just under 20 last November, but also faces a risk of a double top (25.31, May ’07 high; 25.21, Mar ’17 high).
The 50-day is now pointing down, and providing resistance. Time will tell if shorts get more aggressive when the ETF loses 22.80.
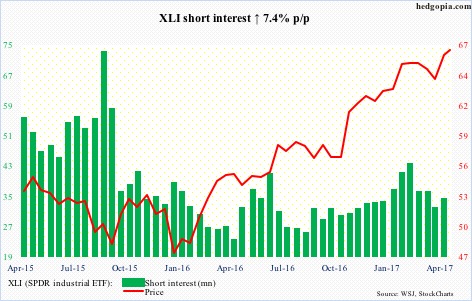
XLI (SPDR industrial ETF)
XLI (66.83) is finding it tough to break out of 67 – essentially sideways since March 1, and likely to come under pressure once it loses 66.
Thus far, shorts are not leaning one way or the other.
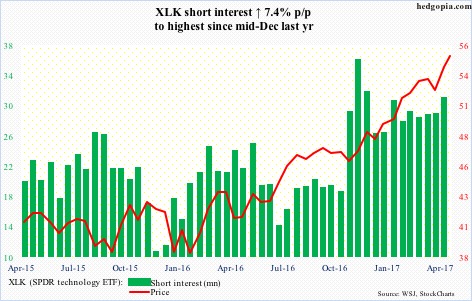
XLK (SPDR technology ETF)
XLK (55.28) keeps grinding higher – to newer and newer highs.
Post-election in November last year, shorts went into overdrive, and are yet to give up their aggression even though the ETF is up 15-plus percent since.
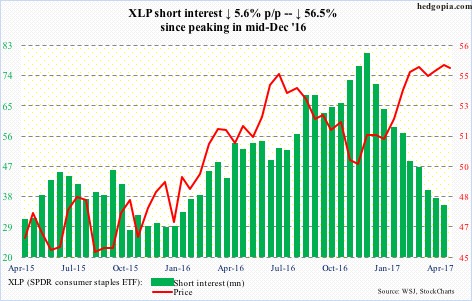
XLP (SPDR consumer stables ETF)
XLP (55) shorts began to get squeezed in the second half of last December, providing a tailwind to the ETF.
Some early signs of fatigue are beginning to show up on XLP. Bears would score a victory if they can push it under 54.40.
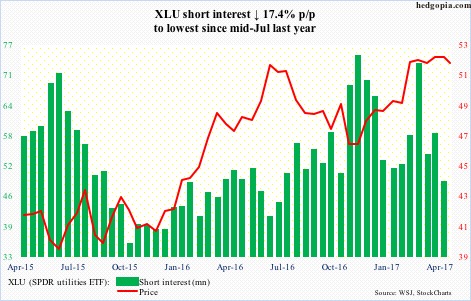
XLU (SPDR utilities ETF)
XLU’s (51.33) chart looks similar to XLP’s.
The 50-day – flattish – was slightly breached Tuesday. A loss of 51 and change likely puts the ETF under more pressure. Leading into this, shorts were cutting back.
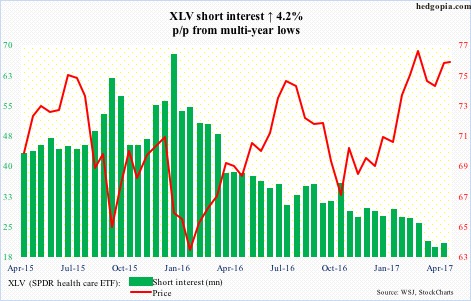
XLV (SPDR healthcare ETF)
Even if XLV (75.59) manages to convincingly break out of nearly two-year resistance at 75-plus, squeeze fuel is lacking. In fact, that may be the reason it is unable to break out – not enough shorts to get squeezed.
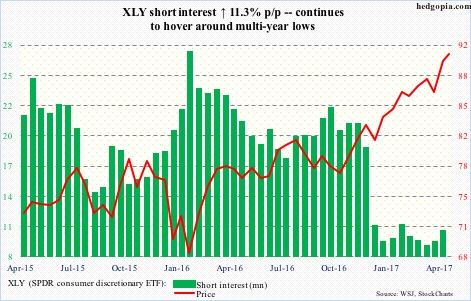
XLY (SPDR consumer discretionary ETF)
XLY (90.86) shorts pretty much stepped out of the way in the latter half of last December. That was prudent.
As overbought as the ETF is, momentum is intact – thus far.
Information posted to this board is not meant to suggest any specific action, but to point out the technical signs that can help our readers make their own specific decisions. Your Due Dilegence is a must! • DiscoverGold
Register for free to join our community of investors and share your ideas. You will also get access to streaming quotes, interactive charts, trades, portfolio, live options flow and more tools.


 News
News  Market Data
  Discover