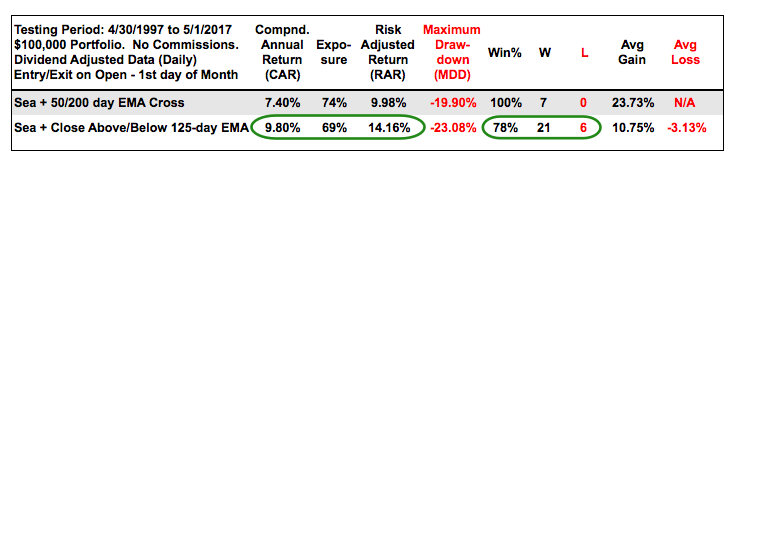
The table below shows the results for seasonality and timing. The golden cross with seasonality worked a little better than the golden cross without seasonality (first table). Seasonality combined with the 125-day EMA cross returned almost 10% per year over the last twenty years. There were two big drawdowns during this period (-23.08% in 2002 and -18.76% in 2008). The five largest drawdowns averaged 16.3%, which is not too bad for a 9.8% Compound Annual Return and a 14.16% Risk-adjusted Return.
Conclusions
There is clearly something to be said for the worst four-month period, which includes the dog days of summer and September. The S&P 500 SPDR is up some 15% from its November low and still in bull mode with the worst four month period right around the corner. Even so, the trend is clearly up and the trend holds more sway than seasonality. Chartist can watch two things as June nears. First, a break below the April low (support) would be negative. Second, a close below the 125-day EMA during June would suggest that a correction is underway and the fish are biting. In other words, that might be the signal that it is a good time to go fishing!
Register for free to join our community of investors and share your ideas. You will also get access to streaming quotes, interactive charts, trades, portfolio, live options flow and more tools.
 News
News  Market Data
  Discover