


Sunday, April 30, 2017 6:03:57 PM
The only positive I could find today was the possibility that the minimal chart's medium-term rising support (rising orange line) might hold. Nothing supports that other than it has held in the past and held today. However, only the origin and today had appreciable volume so although the number of holds suggest strength, the volume during those challenges can't add to that assessment. They don't imply it's weak, just can't add to an assessment that it's a strong support.
Everything else suggests near-term weakening as the most likely near-term behavior. Even the prospect of a Monday and Wednesday PR doesn't offer much hope if you look at the new chart below and see how the PRs have turned from having some positive effect to now appearing to have a negative effect, just like in "the old days".
With the results reporting now anticipated to be sometime in June, I just can't envision DJ pulling a big enough rabbit out of his hat to produce an immediate reversal of the well-established trend that we are in. Best I think we could hope for would be the rabbit is sufficient to get the decline slowed a bit.
Near-term targets include $0.70 (horizontal red line), a not-yet confirmed support (needs a third challenge and successful hold), and then $0.67/$0.66. $0.70 might surprise as it is a "round number".
Today, from 30,000 feet, was an open high and go lower until shortly after 13:00 and then slowly recover some of the loss through around 14:30 before going lower again to close less than a penny above the day's low.
Check the large b/a imbalance to the buy side in the first period and note that in spite of that no upward progress could be made. My TFH tells me those large bids were never intended to execute, but just an attempt to hold price up so that some offers to sell at a high price would have to be (nearly?) met by anyone wanting to get shares for either short-term trading (momo, swing, day traders) or investors thinking the recent spate of PRs made a difference and prices likely would not go much lower. On the offer I would guess were warrant holders or shorters or MMs wanting to naked short high and then cover at the lower prices they helped to cause. Could be all three or any mix if I'm even anywhere near right about that. Always doubtful.
There were no pre-market trades.
B/a just before open was 2K:200 $0.76/8.
09:30-10:11 opened the day with a 392 unknown for $0.7580 & $0.7580 x 385, $0.76 x 2K, $0.75 x 200. B/a just after open was 6.1K:3.1K $0.75/6. Then came 9:33's b/a 16.1K:1.5K $0.7500/87, 9:34's 1.2K $0.7574 (1K)/00, 9:35's 100 $0.75, 9:36's b/a 15.8K:300 $0.7500/70 (offers falling rapidly), 9:47's b/a 15K:2K $0.7500/63, 10:00 16K:300 $0.7541/2, and 10:00's 11K $0.7541 (1K)/00 (7.2K)/41 (100)/00.
That began extremely low/no-volume $0.7500/29 with rising lows and falling highs. B/a at 10:05 was 8.7K:600 $0.7520/31 (offers falling), 10:09 5K:600 $0.7520/2. The period ended on 10:11's 600 $0.7520.
10:12-10:41, after four no-trades minutes, began a drop, relatively large, on 10:16's 14.4K $0.7520 (3.5K)/00 (8.6K)/$0.7430/20 (1.9K). Subsequent trading was extremely low/no-volume with moves coming mostly on large one-minute volume spikes. B/a at 10:18 was 300:1.3K $0.7420/1. 10:29's 900 moved trade to $0.7401 flat. B/a at 10:32 was 13.1K:2.7K $0.7400/33. 10:36's 19K $0.74 (13.4K)/$0.7350/$0.74/$0.7350 ... /$0.7399/50 moved range to $0.7351/83. The period ended on 10:41's 11.1K $0.7376 (10K blk)/51/76.
10:42-11:21 began an extremely low/no-volume slow decline from 10:42's 200 $0.7366/71. B/a at 10:43 was 880:500 $0.7360/65. Volume was interrupted by 10:46's 3K $0.7361 (2K)/60/62/60. 10:49's 2.1K hit $0.7351. B/a at 10:50 was 2.4K:1.3K $0.7351/2. 10:56's 3K hit $0.7350. B/a at 11:17 was 14.1K:1.2K $0.7350/1. The period ended on 11:21's 103 $0.7351.
11:22-12:01 began an extremely low/no-volume small climb from 11:22's 4.1K $0.7352/51/52/81/66/81/$0.75 (900)/$0.7351. B/a at 11:32 was 1.4K:4.7K $0.7400/99. 11:32's 100 hit $0.7499 and began extremely low/no-volume $0.7412/97. B/a at 11:47 was 1.2K:5.2K $0.7400/98. The period ended on 12:01's 150 $0.7497.
12:02-12:54 during the initial six no-trades minutes had b/a at 12:02 of 1.2K:5.2K $0.7400/97. Trade began extremely low/no-volume $0.7350/92, with the highs rapidly collapsing, on 12:08's 3.8K $0.74 and 12:09's 2.2K $0.74/$0.7355/73/51. B/a at 12:15 was 2.8K:2.3K $0.7351/74. Volume was interrupted by 12:18-:19's 5.8K $0.7352/1/0 and 12:21-:22's 10K $0.7350/1/0. B/a at 12:31 was 7.7K:800 $0.7350/1, 12:47 6.4K:700 $0.7350/1. The period ended on 12:54's 200 $0.7350/1.
12:55-13:11, after five no-trades minutes, did a large drop on a few high-volume minutes, after 13:00's 19.8K $0.7350 (15.9K)/49/10 (3.8K). B/a at 13:02 2.7K:2.2K $0.7310/42. 13:08's 2.9K did $0.7310/06/00, 13:10's 29.2K did $0.7301 (2.7K)/00, and the period ended on 13:11's 21.2K $0.73/$0.7297/54/97/10.
13:12-14:09 began an extremely low/no-volume (mostly) partial recovery of the recent drop on 13:16's 2.5K $0.721. 13:18's 100 did $0.74. B/a at 13:23 was 300:1.1K $0.7220/$0.74. 13:24's 705 did $0.7399/00/$0.7221 and 13:27's 2.5K did $0.7234/$0.73/$0.7288. That began extremely low/no-volume $0.7253/$0.73. B/a at 13:36 was 2.3K:2.1K $0.7250/$0.73, 13:47 2.4K:1.2K $0.7267/$0.73, 14:01 2K:600 $0.7267/68. At 13:55 range had narrowed to $0.7267/8. The period ended on 14:09's 100 $0.7268.
14:10-15:32, after four no-trades minutes, began an extremely low/no-volume decline from $0.73/4 on 14:14's 100 $0.74. B/a at 14:17 was 2.1K:500 $0.7267/$0.7399, 14:31 2.1K:600 $0.7270/$0.7399 (bids rising). By 14:34 range was $0.7289/$0.7311. B/a at 14:47 was 1.1K:1.3K $0.7268/78 (offers falling). At 14:50 range was $0.7251/68. B/a at 15:01 was 481:1.1K $0.7250/1. At 15:09 range was $0.7239/51 and 15:17 was $0.7227/8. B/a at 15:18 was 1.2K:1.2K $0.7226/8, 15:31 1.2K:1K $0.7226/7. The period ended on 15:32's 231 $0.7227.
15:33-16:00, after one no-trades minute, stepped up and began extremely low/no-volume $0.7245/52, through 15:52, on 15:34's 3.8K $0.7227/26 ... /82/97/62. B/a at 15:46 was 900:500 $0.7250/2. 15:53's 700 widened the range, doing $0.7299, but it started collapsing right away and the period and day ended on 15:59's 2.9K $0.7252/50/26 (500) and 16:00's 886 buy for $0.73.
There were no AH trades.
Excluding the opening and closing trades (didn't qualify), there were 7 larger trades (>=5K & 2 4K+) totaling 47,707, 18.54% of day's volume, with a $0.7374 VWAP. For the day's volume, both the count and percentage of day's volume is on the low side. The VWAP is above the day's $0.7347, leading me to think the usual buyers were taking shares - retailers, maybe some short-term traders and shorters/MMs doing covering buys. These latter ones make sense given a VWAP down ~4,3% from yesterday's.
Excepting the normal opening period manipulated price range, the VWAP and buy percentage were generally well connected, so all that's a sign of normalcy. The buy percentage dropping so low, and relatively quickly initially, after the up-tick in the 10:41 period seems a little odd though. I wonder if warrant holders were back. I don't see quite the same convincing behavior as I did before though. MMs making money by naked shorting and then covering is a possibility. When they see weakness and no strong buying pressure that's one thing they can do to make some money. Always possible shorters, who also respond to perceived weakness, shorted into the market. Both of theses latter scenarios would be supportable by the data.Ending Period Period Period __Per. Trade_ Period_ % Day_ Per. End
Period Volume Low High _Dollar Val._ VWAP___ Volume Buy ~%
10:11 17647 $0.7500 $0.7600 $13,278.31 $0.7524 6.86% 9.11%
10:41 47391 $0.7350 $0.7520 $35,167.19 $0.7421 18.42% 46.47% Incl 10:16 $0.7500 6,000 10:36 $0.7400 9,907
10:41 $0.7376 10,000
11:21 23944 $0.7350 $0.7371 $17,603.79 $0.7352 9.30% 37.98%
12:01 5204 $0.7351 $0.7500 $3,850.75 $0.7400 2.02% 39.46%
12:54 26967 $0.7350 $0.7400 $19,845.71 $0.7359 10.48% 34.03%
13:11 75560 $0.7210 $0.7350 $55,241.49 $0.7311 29.36% 25.00% Incl 13:00 $0.7350 4,400 7,600
14:09 15926 $0.7210 $0.7400 $11,553.19 $0.7254 6.19% 26.10%
15:32 24621 $0.7227 $0.7400 $17,935.05 $0.7284 9.57% 31.01% Incl 14:41 $0.7300 4,800 5,000
16:00 17627 $0.7226 $0.7300 $12,789.69 $0.7256 6.85% 30.52%
On the traditional TA front, movements were:
Well, we gave back more than yesterday's gains, in absolute terms, on everything but the open (surprised?), which opened at $0.7580 vs. $0.75 two days ago. The worst part was it was on volume that rose significantly even from that two days ago: ~230.1K, ~90K and today ~257.3K. That's a pretty good negative indication there considering a Friday often has low volume and flattish behavior (although it hasn't been that reliable recently.__Open_ ___Low_ __High_ _Close_ Volume_
Today -2.82% -5.13% -2.56% -3.95% 185.84%
Prior 4.00% 2.43% 0.65% -1.75% -60.87%
Time for a new minimal chart I guess.
On my minimal chart, two days back I said { If today's action is correctly read by me, as warrant holders being gone, we can again hope (expect?) the rising support to hold if it's challenged. }
Today warrant holders may have been here, but I couldn't judge that as confidently as I did before. BTW, see following comment about the triangle.
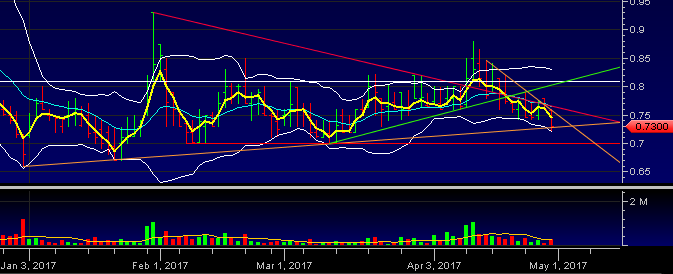
The most significant thing today is trade range penetrated the medium-term rising support (rising orange line) and came back up to eventually close right on the line. The fact that support held may be supporting evidence that warrant holders were not in the market. We'll never know.
The next most significant thing is that a new short-term descending resistance has been added, the descending orange line. Notice that today's high lined up quite nicely with it and being the sixth "touch" since the origin the line is a confirmed, and apparently strong, resistance. Of course some of that apparent strength may result from the proximity of the medium-term descending resistance (descending red line).
I also said { If you think of the medium-term rising support (orange line) and falling resistance (red line) as forming a triangle, we are no [sic] at a lateral point along its width where a break becomes highly likely. Of course, we could just sidle along and exit stage right through the apex, but that seems unlikely. If we do, that suggests to me we are entering another long-term consolidation. We've been in a medium-term one for quite a while and in and out of short-term ones. }
The sidle out through the apex wasn't identified as a strong possibility before and looks even less likely now. The fact that we challenged the support line today and didn't challenge the new short-term descending resistance says something important I think - the near-term bias is down regardless of the PR and expectations that we might get two more the next week.
We've started "pushing" the lower Bollinger band limit again, not a good sign. Trading range was completely below the falling mid-point too.
The fast EMA continues below the slow EMA and continues to decline, as did the slow EMA. Now the gap is $0.0197 (was $0.0089) below it. Yesterday's thought seems to have held true: { Regardless of the gap narrowing, due to the slow EMA falling faster than the fast EMA, I think the fast below the slow with both falling is suggesting near-term more weakening. }
I'll finish this section with few "likelihoods".
If, as I expect, we break below the rising medium-term support, we have a potential support at $0.70 (the horizontal red line). It has only the origin's clump of days and one other test of two consecutive days though so we don't know if it's really support or not and how strong it might be. Trade volume was pretty good around the origin, suggesting strength at that time but was quite a bit lower at the subsequent challenge, offering no clue as to it's strength then or what it might be now.
It has a possible "round number" benefit - folks tend to see round numbers as more attractive spots than non-round numbers. Nothing here suggests the risk is low enough to bet the farm though.
If we break through that, the next likely level of support, and therefore potential reversal, is $0.67/$0.66.
Possibly obviating the need for the above considerations is the possible twice-weekly PRs. It's possible DJ has something really big up his sleeve that could push the share price dramatically upward. However, even if it's a significant item you can look at the chart's recently behavior and see that the PRs have had a declining effect, both in terms of amount of gain and duration. In fact it now looks like the old behavior has returned - positive PR equals lower share price.
We'll never know exactly why, but that's what the patterns are telling us.
On my one-year chart things not looking good. Trading range was completely below all SMAs, all of which are falling and the 10-day is about to cross below the 50-day SMA (16/100ths of a cent to go).
Unlike yesterday there was no brief penetration of the long-term descending resistance - the high never approached it as even the normal "open high and go higher" failed to materialize. Instead we got an "open high, go flat and begin falling" after the first 45 minutes. This kicked off a day-long flat, drop, flat, drop, ... through 13:15ish. That finally began a somewhat raggedy recover a bunch and give about half back, go flat, recover it again, drop, go flat, ... through about 14:40. Then it was raggedy sideways just above the day's low into a close 9/10ths of a cent above the low.
All was on mostly low/no-volume trading with the usual interspersed high-volume minutes as "The Dark Side" took advantage of what had been provided for them.
As before, we've entered a behavioral pattern that makes projection of coming SMA behavior seem useless. So I'll again suspend comment about them for now.
Yesterday the oscillators I watch had weakening in every oscillator I watch, but for MFI (untrusted by me) and full stochastic. Those two exceptions improved. Every one is below neutral. Williams %R continues in oversold condition as full stochastic exited oversold. MFI is close to it.
Today is almost a repeat of yesterday. We again had, but for MFI (untrusted by me) and full stochastic, weakening in every oscillator I watch. Those two rose and MFI moved further from oversold. Again, every one is still below neutral. Williams %R continues in oversold condition as full stochastic continues to rise further above oversold.
The experimental 13-period Bollinger limits, $0.7204 and $0.8306 ($0.7302 and $0.8338 yesterday), continue diverging this time, with a falling mid-point as the both limits declined, the lower faster than the upper.
All in, today seems to have justified yesterday's { With the preponderance of indications being negative I even have to give up yesterday's "best case scenario" of consolidation (with a grudging "mild negative bias" considered but not endorsed) and now have to lean heavily over to the bearish side - near-term weakening seems most likely ATM. }
No positive indications from any of the intra-day behavior, the intra-day breakdown, or the conventional TA. Everything does suggest near-term negative movements as most likely. The one possible exception is the medium-term rising support (rising orange line) could hold if warrant holders are not in the market. Odds? I don't know but everything leading up to this point suggests weakening is the trend and the traders' adage holds that "the trend is your friend".
Further, we see the descending medium-term resistance is strong, by both number of tests and volume during the periods it has acted as resistance, then support and then resistance again. There's presently no TA reason to think it will be penetrated right now.

Percentages for daily short sales and buys moved in opposite directions, not good, and short percentage moved above my desired range (needs re-check) while EOD buy percentage dropped out of "no man's land" into "grave digger territory".
The spread widened and was produced by a bad intra-day behavior - generally a high open (with no "move higher") and after the first 45 minutes a general long trend down trough most of the day, finally closing just a hair above the day's low. Being in a down trend this suggests more movement is likely and likely down.
The VWAP's rolling average of the last twenty-four movements, after holding steady for two consecutive days at 12 negatives and 12 positives, deteriorated to 13 and 11 respectively. Change since 03/24 is -$0.0301, -3.93%, and the averages of the rolling 24-day period seen in the last few days (latest first) are now -0.1311%, 0.1088%, 0.0842%, -0.2035%, -0.1687%, -0.0279%, 0.1106%, 0.3283%, 0.2923%, and 0.5141%.
Checking the above table, note that today's VWAP change was unusually large - largest since 4/18's -5.62%, a Tuesday after one of our Monday PRs.
All in, everything here says more near-term weakening is the most likely scenario.
Bill
Join the InvestorsHub Community
Register for free to join our community of investors and share your ideas. You will also get access to streaming quotes, interactive charts, trades, portfolio, live options flow and more tools.

