


| Followers | 679 |
| Posts | 140829 |
| Boards Moderated | 36 |
| Alias Born | 03/10/2004 |
Sunday, April 09, 2017 9:14:27 AM
By Clive Maund | April 8, 2017
Silver’s latest charts show that it is set up for a potentially severe decline, a situation that is aggravated by its latest COTs and Hedgers charts showing record extreme readings, which mean BIG TROUBLE for silver.
Now, you might think, like so many traders did on Friday morning, that with Cruise Missiles flying around the Mid-East, the outlook for the Precious Metals couldn’t be better, but the charts are saying that this is an opportunity – on the short side – dressed up in a crisis that will soon ease.
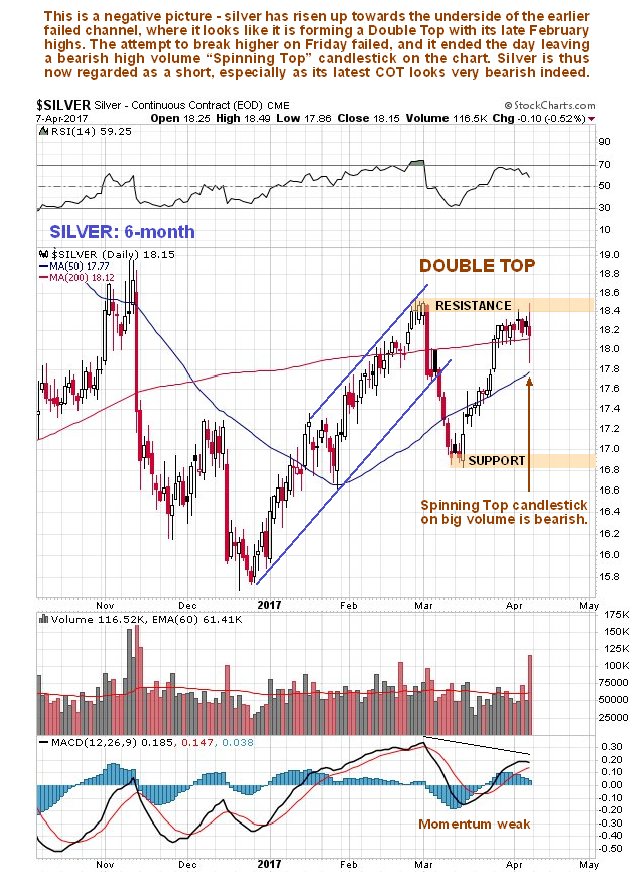
Action in silver on Friday was very bearish as we can see on its 6-month chart below – it tried to break higher in the morning but the breakout attempt failed and it dropped back, zig-zagging around and leaving behind a high volume “Spinning Top” candlestick on its chart, so that it looks like it is about to break down from a Double Top with its highs of late February.
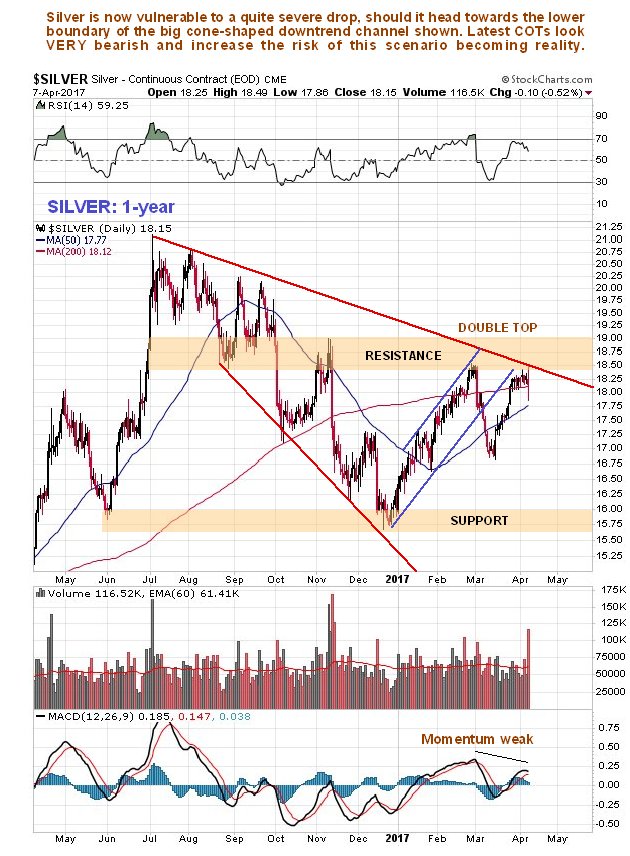
The 1-year chart shows silver perched on the edge of a cliff, at the top of a big expanding downtrend channel with no relief in sight until it reaches the support level shown, and COTs and Hedgers charts show that it could drop much further – to the lower boundary of this expanding channel.
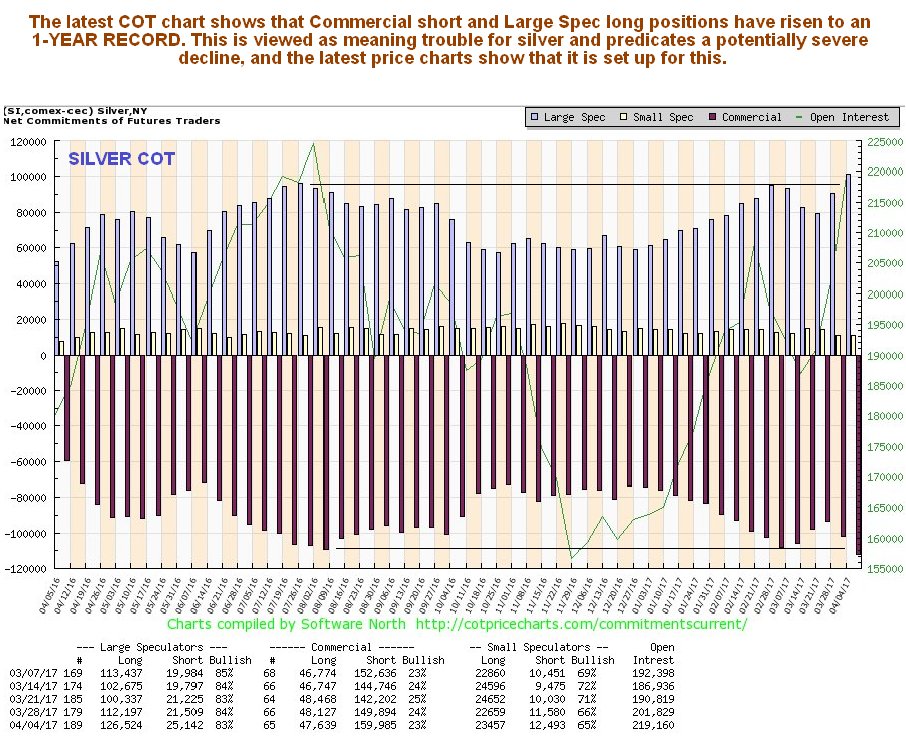
The risk of silver tipping into a potentially severe decline from here is amplified by its latest COT chart readings, which show that Commercial short and Large Spec long positions have risen to at least one-year extremes. This is viewed as meaning BIG TROUBLE for silver.
The gravity of the situation facing silver is made even more clear by the latest Hedgers’ chart, which shows that Hedgers’ positions are at all-time bearish extremes. This chart makes it extremely unlikely that silver will or can advance from here – more likely is a severe decline back towards the lower boundary of the expanding channel shown on silver’s 1-year chart above. Needless to say, the grim outlook for silver set out here also has bearish implications for gold, where the COT and Hedgers’ charts are nowhere near as decisive.
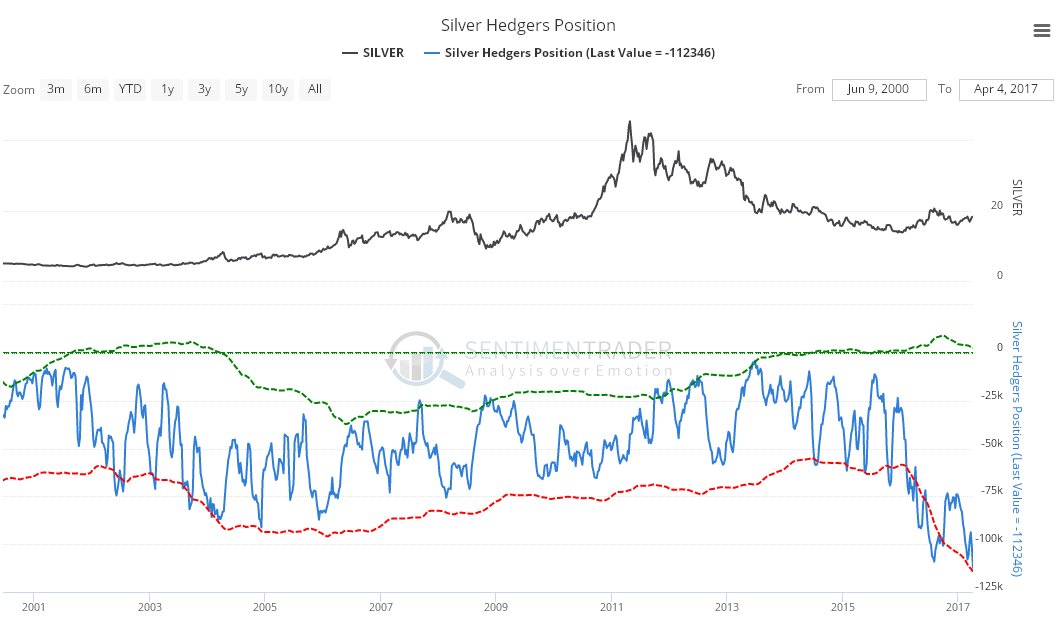
Chart courtesy of sentimentrader.com
Experienced traders will doubtless be able to find ways to turn this situation to their advantage.
https://www.clivemaund.com/free.php?id=67
• DiscoverGold
Click on "In reply to", for Authors past commentaries
Information posted to this board is not meant to suggest any specific action, but to point out the technical signs that can help our readers make their own specific decisions. Your Due Dilegence is a must!
• DiscoverGold
FEATURED Cannabix's Breath Logix Alcohol Device Delivers Positive Impact to Private Monitoring Agency in Montana, USA • Apr 25, 2024 8:52 AM
Bantec Reports an Over 50 Percent Increase in Sales and Profits in Q1 2024 from Q1 2023 • BANT • Apr 25, 2024 10:00 AM
Kona Gold Beverages, Inc. Announces Name Change to NuVibe, Inc. and Initiation of Ticker Symbol Application Process • KGKG • Apr 25, 2024 8:30 AM
Axis Technologies Group and Carbonis Forge Ahead with New Digital Carbon Credit Technology • AXTG • Apr 24, 2024 3:00 AM
North Bay Resources Announces Successful Equipment Test at Bishop Gold Mill, Inyo County, California • NBRI • Apr 23, 2024 9:41 AM
Epazz, Inc.: CryObo, Inc. solar Bitcoin operations will issue tokens • EPAZ • Apr 23, 2024 9:20 AM

