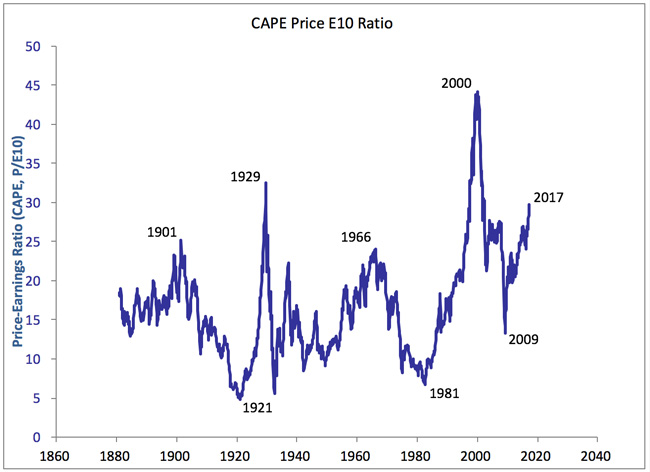
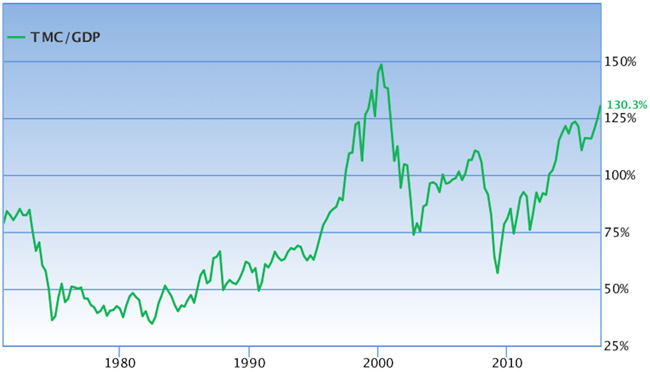
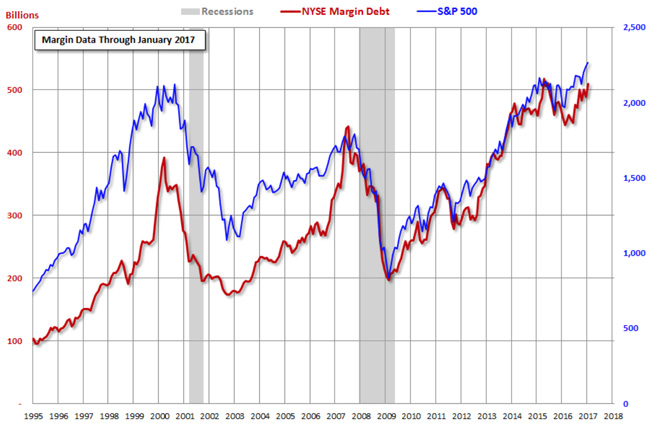
(Note - Looking closer at 3 of those 5 charts (see below), what strikes me is that in all 3 charts the current situation has not gone fully parabolic yet (not even close), as it had done during the previous market peaks (2007, 2000, 1929).
That suggests that despite the current overvaluations and relatively high readings, there is considerably more room to go before they reach the previously seen peaks, ie they need to replicate the hyperbolic steepness seen previously.
I remember Alan Greenspan's 'irrational exuberance' comment, which he made in late 1996, a full 3 years before the market made its actual peak. At 8 years, the current bull market is historically long, but since the Fed is so keen/desperate to normalize interest rates, and since they'll need a stable market to accomplish that, they will therefore be highly motivated to maintain a buoyant market. That's the theory anyway..)
Cyclically adjusted, price-to-earnings ratio (CAPE) -
Total market cap relative to GDP (Warren Buffet’s favorite valuation metric)
Register for free to join our community of investors and share your ideas. You will also get access to streaming quotes, interactive charts, trades, portfolio, live options flow and more tools.
 News
News  Market Data
  Discover