Russell 2000 At Bottom End Of Range – Likely Gives Way
* March 22, 2017
Did U.S. small-caps lead or lag in the past four months? Depends on the timeframe.
Post-November 8 election through the March 1 all-time high, the Russell 2000 small cap index rallied 18.4 percent. Year-to-date through that record high, it tacked on 4.3 percent. In the corresponding period, the S&P 500 large cap index rallied 12.2 percent and 7.2 percent, respectively, and the Nasdaq composite 13.8 percent and 9.8 percent.
Since that record high, indices have come under pressure. Here is the scorecard for this year after Tuesday’s mini collapse: S&P 500 up 4.7 percent, Nasdaq up 7.6 percent and Russell 2000 down 0.8 percent.
In other words, the Russell 2000 led its larger peers in the immediate weeks and months after the election, but began to seriously lag this year. Tech – large-caps, in particular – retook the leadership as 2017 began.
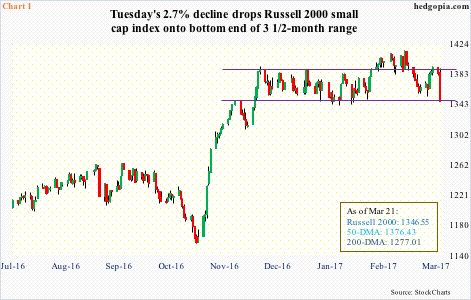
In fact, the Russell 2000 has been going sideways for three and a half months now – caught between 1347 on the down and 1392 on the up (Chart 1). For a brief period in the second half of February, it broke out of the range and rallied to 1414.82, but that did not last. With several unsuccessful attempts to take out resistance and Tuesday’s 2.7-percent drop, the index sits right at support.
In the aggregate, flows are not helping much.
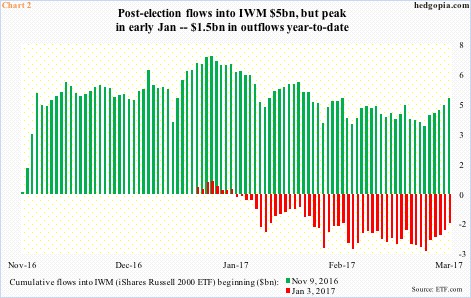
On the surface, post-election, IWM, the iShares Russell 2000 ETF, attracted $5 billion through Monday. But once again, as is the case with the Russell 2000, flows began to weaken this year. From November 9 through January 6, the ETF attracted $7.2 billion, but year-to-date $1.5 billion has been redeemed (Chart 2).
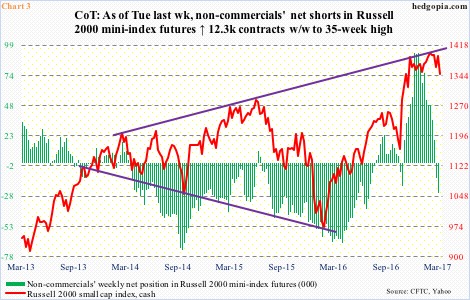
By sheer coincidence – or not – non-commercials, too, began to pull in their bullish horns early this year. In the week ended January 3, these traders were net long 92,652 contracts in Russell 2000 mini-index futures – a record. They then gradually began to lighten up, and went net short two weeks ago. In the latest week, they were net short 24,670 contracts – a 35-week high.
Both non-commercials’ holdings and IWM flows help explain why the Russell 2000 is stuck in a range. And then there is this!
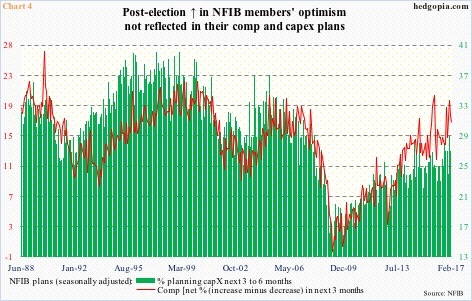
Post-election, the National Federation of Independent Business (NFIB) optimism index jumped 10.9 points in November and December to 105.8 – a 12-year high. Then the euphoria wore off. January inched up to 105.9, while February inched down to 105.3. Sideways – once again.
Importantly, as optimistic as small businesses are, they are yet to plan on adding to capital expenditures or giving a raise to employees. At 26, February’s capex plans were lower than 27 last October. Similarly, comp plans were 17 in February, versus 19 last October.
Arguably, NFIB members are waiting for the Trump administration to deliver on promises of less regulations and tax cuts. The problem is, small-cap stocks have priced in a lot already.
While this explains the sideways action in the Russell 2000, this also makes it vulnerable. Vulnerable because the sideways action the past three and a half months must be testing longs’ patience – particularly those that got in early and are sitting on paper profit.
Here is the rub.
Yes, Tuesday was brutal, but it is conceivable technically-minded traders have not sold. Support at 1347 has not given way, which means more potential supply ahead.
In the meantime, IWM shorts have been adding. End-February short interest stood at 117.6 million – a three-month high and up from 93.7 million from mid-January. At some point, this should help the Russell 2000 stabilize as these shorts cover. But for now, the path of least resistance is down.
Worse, the 200-day moving average is 5.2 percent away.
Information posted to this board is not meant to suggest any specific action, but to point out the technical signs that can help our readers make their own specific decisions. Your Due Dilegence is a must! • DiscoverGold
Register for free to join our community of investors and share your ideas. You will also get access to streaming quotes, interactive charts, trades, portfolio, live options flow and more tools.


 News
News  Market Data
  Discover