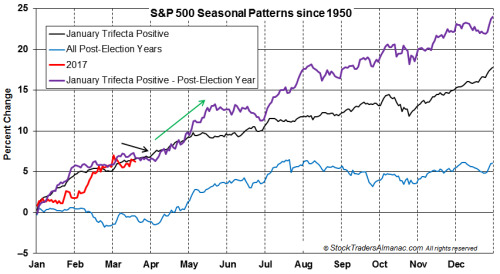
Positive January Trifecta Pattern Indicates Next Leg Higher Begins in Early April By Almanac Trader | March 18, 2017
In the following chart S&P 500 historical average performance has been plotted comparing “All Post-Election Years,” “January Trifecta Positive,” “January Trifecta Positive - Post-Election Year” and 2017 as of today’s close. Thus far, S&P 500 has been tracking “January Trifecta Positive - Post-Election Year” (purple line) rather closely. Even March’s mild downtrend is mirroring the historical pattern. Should S&P 500 continue to track this pattern, then it is likely to begin its next leg higher in early April just as earnings season gets underway in earnest.
Click on "In reply to", for Authors past commentaries
Information posted to this board is not meant to suggest any specific action, but to point out the technical signs that can help our readers make their own specific decisions. Your Due Dilegence is a must! • DiscoverGold
Register for free to join our community of investors and share your ideas. You will also get access to streaming quotes, interactive charts, trades, portfolio, live options flow and more tools.


 News
News  Market Data
  Discover