


Saturday, March 11, 2017 10:28:12 AM
I will not attempt a mathematical explanation of the indicators but if you want to look at them I suggest Investopedia.com for definitions.
First I want to see the overall impact on the stock.
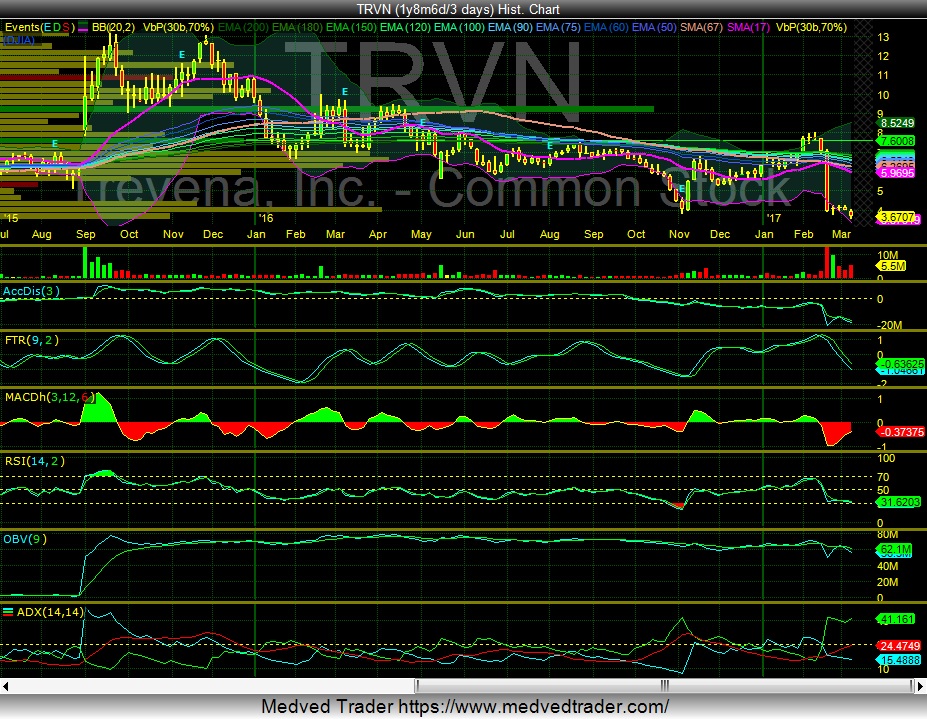
I'm starting with a three day chart to smooth out the effect of painting the tape at close.
A warning about volume - both the volume up and the volume down can be made up of wash trades between institutions or hedge funds. It can not be interpreted as the actual sale of shares.
I've found the FTR (Fisher Transform) is an excellent leading indicator and it is still strongly negative.
ADX does not show a definitive positive trend since 2015. This is most likely due to IPO participants doing a P&D and taking profits.
Post below contains an error - should be 4th quarter, but institutions did lighten up and we should be looking for evidence that they may be re-entering at some point.
http://investorshub.advfn.com/boards/read_msg.aspx?message_id=128903755
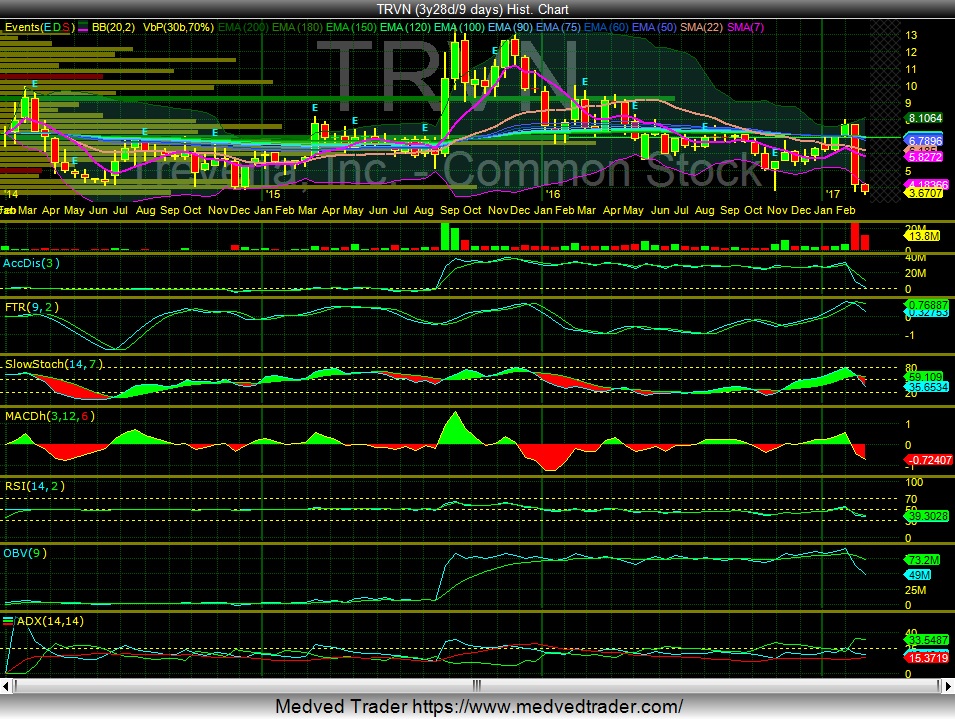
On the nine day chart (as you pull out in time the indicators become more general and abstract which sometimes gives insight) there is some bullishness just before the crash in FTR which indicates institutional interest (but they usually hedge with options in a case like this).
OBV was also slightly positive, but not what I would call truly bullish. Note that ADX was negative most of the time and it is truly bearish now.
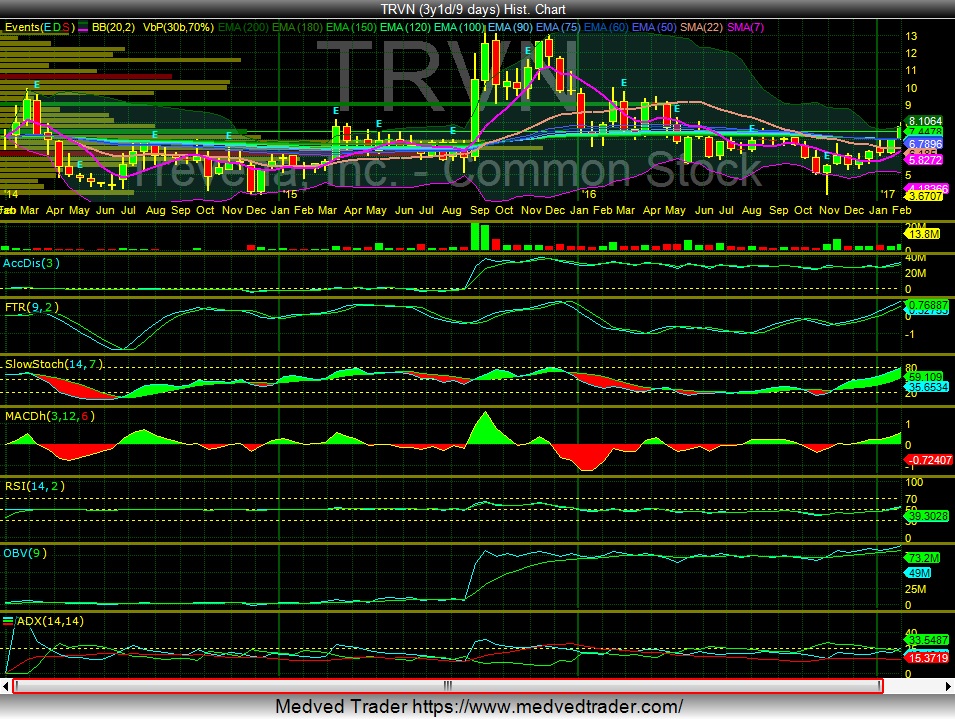
The software I use allows me to back out and see what the chart looked like before the crash. It is slightly bullish but there is no confirmatory volume. That could come from lack of supply though, if it's a really good company a move like we've seen here can be used to displace retail, but it will take a while to work out the liquidity in the dump.
I've invested and lost in TTPH - a similar situation, but I kept studying the charts there and the insights were invaluable. I persisted (we women can be that way :) and kept a small investment and studying the charts. It turned out that the key in a situation like this (assuming the drug does have a sizeable market, fundamentals are critical) seems to be a narrowing of long term indicators and a switch to a positive bias. Then I saw a bump in volume intraday with a retrace. That was the perfect time to take a full position, and I was rewarded.
That is the sort of thing you want to watch for here if you are convinced of the stock's fundamental value.

In Peace, In War
Recent TRVN News
- Form 8-K - Current report • Edgar (US Regulatory) • 03/06/2024 10:00:24 PM
- Form DEF 14A - Other definitive proxy statements • Edgar (US Regulatory) • 02/20/2024 09:06:01 PM
- Form SC 13G/A - Statement of acquisition of beneficial ownership by individuals: [Amend] • Edgar (US Regulatory) • 02/14/2024 07:34:30 PM
- Form PRE 14A - Other preliminary proxy statements • Edgar (US Regulatory) • 02/09/2024 09:05:33 PM
- Form 8-K - Current report • Edgar (US Regulatory) • 02/01/2024 12:05:28 PM
- Form 424B3 - Prospectus [Rule 424(b)(3)] • Edgar (US Regulatory) • 01/23/2024 09:15:32 PM
- Form EFFECT - Notice of Effectiveness • Edgar (US Regulatory) • 01/23/2024 05:15:19 AM
- Form S-3/A - Registration statement under Securities Act of 1933: [Amend] • Edgar (US Regulatory) • 01/19/2024 09:30:30 PM
- Form S-3 - Registration statement under Securities Act of 1933 • Edgar (US Regulatory) • 01/10/2024 09:30:58 PM
- Form 8-K - Current report • Edgar (US Regulatory) • 01/08/2024 12:01:27 PM
- Form 8-K - Current report • Edgar (US Regulatory) • 12/28/2023 07:09:21 PM
- Form 4 - Statement of changes in beneficial ownership of securities • Edgar (US Regulatory) • 12/15/2023 11:57:47 PM
- Form 4 - Statement of changes in beneficial ownership of securities • Edgar (US Regulatory) • 12/15/2023 11:57:32 PM
- Form 4 - Statement of changes in beneficial ownership of securities • Edgar (US Regulatory) • 12/15/2023 11:57:10 PM
- Form 4 - Statement of changes in beneficial ownership of securities • Edgar (US Regulatory) • 12/15/2023 11:56:52 PM
- Form 4 - Statement of changes in beneficial ownership of securities • Edgar (US Regulatory) • 12/15/2023 11:56:10 PM
- Form 4 - Statement of changes in beneficial ownership of securities • Edgar (US Regulatory) • 12/05/2023 10:51:37 PM
- Form 4 - Statement of changes in beneficial ownership of securities • Edgar (US Regulatory) • 12/05/2023 10:50:51 PM
- Form 4 - Statement of changes in beneficial ownership of securities • Edgar (US Regulatory) • 12/05/2023 10:50:07 PM
- Form 4 - Statement of changes in beneficial ownership of securities • Edgar (US Regulatory) • 12/05/2023 10:49:27 PM
- Form 4 - Statement of changes in beneficial ownership of securities • Edgar (US Regulatory) • 12/05/2023 10:47:39 PM
- Form S-3 - Registration statement under Securities Act of 1933 • Edgar (US Regulatory) • 12/01/2023 10:12:10 PM
- Form 8-K - Current report • Edgar (US Regulatory) • 11/09/2023 10:21:03 PM
- Form 8-K - Current report • Edgar (US Regulatory) • 10/02/2023 11:05:20 AM
- Form 4 - Statement of changes in beneficial ownership of securities • Edgar (US Regulatory) • 09/18/2023 09:26:45 PM
FEATURED Cannabix's Breath Logix Alcohol Device Delivers Positive Impact to Private Monitoring Agency in Montana, USA • Apr 25, 2024 8:52 AM
Kona Gold Beverages, Inc. Announces Name Change to NuVibe, Inc. and Initiation of Ticker Symbol Application Process • KGKG • Apr 25, 2024 8:30 AM
Axis Technologies Group and Carbonis Forge Ahead with New Digital Carbon Credit Technology • AXTG • Apr 24, 2024 3:00 AM
North Bay Resources Announces Successful Equipment Test at Bishop Gold Mill, Inyo County, California • NBRI • Apr 23, 2024 9:41 AM
Epazz, Inc.: CryObo, Inc. solar Bitcoin operations will issue tokens • EPAZ • Apr 23, 2024 9:20 AM
Avant Technologies Launches Advanced AI Supercomputing Network and Expansive Data Solutions • AVAI • Apr 23, 2024 8:00 AM

