


Thursday, March 09, 2017 7:04:58 PM
>>> This Mini-Bubble Could Burst at Any Moment
By James Rickards
March 8, 2017
https://dailyreckoning.com/mini-bubble-burst-moment/
This Mini-Bubble Could Burst at Any Moment
Whenever stocks rise sharply for a sustained period, or rise more than a few days or weeks in a row, as had been the case until these past few days, there is always some pundit quick to label the trend a “bubble” and advise investors to run for the exits.
Usually the pundits are wrong. Most so-called bubbles are not bubbles at all, they’re just short-term trends driven by sentiment or momentum. Those trends may slow down or even reverse, but they don’t burst catastrophically the way real bubbles do.
So pundits who yell “bubble” too often are marginalized as doom-and-gloomers, perma-bears, or the boy who cried wolf.
Yet bubbles are real.
They do burst suddenly and catastrophically, and most investors do lose fortunes when they burst. The art of analysis consists of recognizing the difference between real bubbles and mere short-term trends.
My job is to use the right tools to spot real bubbles, and warn readers in time to avoid losses and even make gains as markets are crashing.
U.S. equity markets today are flashing red when it comes to bubble potential.
True bubbles happen for a variety of fundamental and psychological reasons. Below are two of the most famous stock charts in history.
Chart 1 traces the Japanese stock bubble of 1983 to 1989, which resulted in a spectacular collapse of the Nikkei 225 Index beginning on January 1, 1990.
Famously, that Japanese bubble included real estate as well as stocks. In 1989, the land inside the Imperial Palace Walls in central Tokyo (a three-mile circumference) was said to be worth more than all the land in California.
At the end of Japan’s lost decade, the Nikkei Index stood almost 75% below the peak it reached in late 1989.
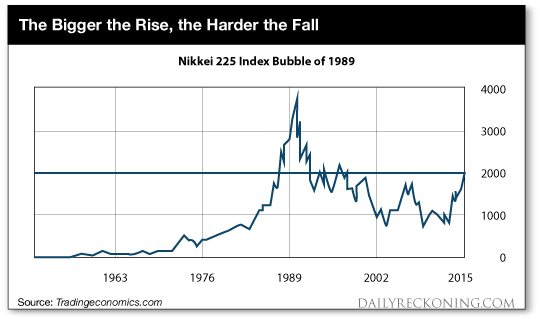
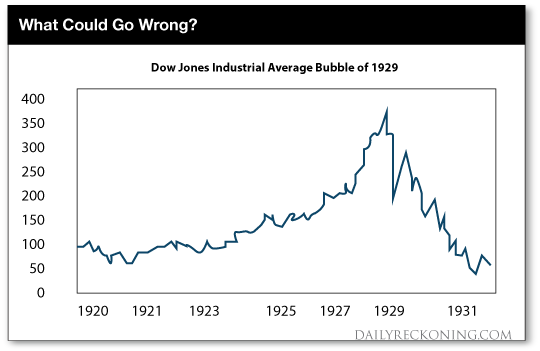
Chart 2 is the U.S. stock bubble of the “Roaring Twenties” as shown in the Dow Jones Industrial Average. That crash began on October 24, 1929 (“Black Thursday”) and reached a crescendo on October 29, 1929 (“Black Tuesday”).
The 1929 crash ushered in the Great Depression, which persisted until 1940. At the lows, the Dow Jones index had fallen more than 85% from the 1929 high. Stocks did not recover their pre-crash levels until 1954, a full quarter-century after the crash.
The bubble dynamics are easily seen from these charts. Bubbles do not emerge from depressed conditions or prior collapse. The memories of prior losses are usually enough to prevent investors from engaging in bubble behavior.
Instead, bubbles follow periods of growth and persistent stock market gains. The original stock gains are based on fundamentals. Japan in the 1980s and the U.S. in the 1920s were both highly productive and fast-growing economies. Stock market gains made perfect sense.
Bubbles emerge at the end of long expansions when memories of the last crash fade, and euphoria replaces common sense. At that stage, the slope of the market index curve steepens at an accelerating rate.
The chart no longer rises gently; it rises vertically in a hyperbolic fashion. The result is the famous “hockey stick” image of a gently sloping base with a steeply sloping handle. That is visible in both Chart 1 and Chart 2.
The other characteristic of bubbles is that they persist much longer than many observers expect. It would have been easy (and not wrong) to yell, “bubble” in the U.S. in late 1928 or in Japan in late 1988. Yet markets powered higher despite the warnings. Those who issue early warnings are regarded as cranks. Those who short the market too soon can lose their shirts. Yet, those issuing warnings ultimately proved correct.
The Dow is up over 25% and the S&P 500 is up over 20% over the past year. More than half the gains for both indices were realized in the 3 ½ months since Donald Trump’s election as president:
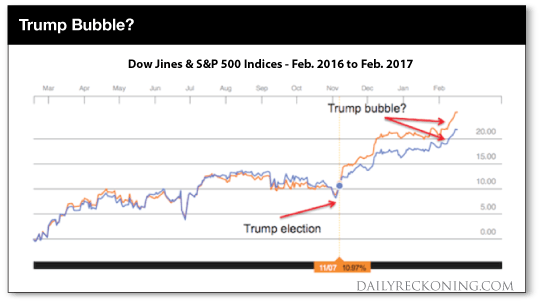
Is the stock market in a bubble now? Has the “Trump Trade” resulted in the same bubble dynamics we saw in 1929 and 1989?
Superficially, Chart 3 does not exhibit the extreme hockey stick behavior of Charts 1 and 2. It’s true that stocks have been rallying since Trump’s election. But Chart 3 covers only a one year period, compared with the five year build-up to the 1929 and 1989 crashes. This goes to the point that bubbles persist much longer than investors expect.
Based on the history of 1929 and 1989, an analyst might expect a bubble bursting in 2020 from a level of Dow 50,000! That might even be a good prediction, but investors who sit on the sidelines until 2020 could miss the greatest market rally in history.
But, there’s a lot more to dynamic systems analysis than superficial chart comparisons. For a short-term prediction, it’s helpful to utilize the concept of scale-invariance. This concept applies to complex systems such as capital markets, and derives from fractal mathematics.
Scale-invariance simply means that the same patterns repeat themselves at all scales large and small.
The images below are a good example of scale-invariance in nature. If you look at the leaf on the left, you’ll notice that the individual petals on the leaf are exact replicas of the leaf as a whole. Look closer and you’ll see that the petals have separate offshoots that are exact replicas of the petal, and so on. The basic shape of the leaf repeats itself at progressively smaller scales.

The same is true in the spiky bush on the right. You’ll notice that the pattern of large spikes with small spikes sticking out and smaller spikes sticking out is repeated over-and-over at every scale. Scale-invariance is ubiquitous in nature and can be seen in everything from sand ripples to waves, mountain ranges and the shapes of clouds.
Guess what? Research proves that scale invariance applies to the time series of stock prices also. Stock markets are complex systems that behave just like many natural systems. In fact, stocks markets can be regarded as a “natural” system because their patterns are dictated by human behavior and human nature.
Now take a closer look at the 2016-2017 stock market chart above and isolate the segment for January and February 2017. It closely resembles the pre-crash dynamics of the 1929 and 1989 crashes on a smaller scale. Here’s that segment in isolation:
Patterns in the Stock Market
Scale invariance metrics teach us that there can be many “mini-crashes” that exactly resemble the great crashes on a smaller scale. This is exactly like the small leaf petals that closely resemble the larger leaf in nature.
We don’t have to conclude that the Dow Jones will crash 80% to Dow 4,000 (it might someday, but probably not yet). Scale invariance teaches that a mini-crash could cause the Dow to give up 80% of its gains since January 1, 2017, which would put it down almost 700 points to 19,935.
A comparable drop would push the S&P 500 down 90 points to the 2,260 level. Both corrections would be “80% crashes,” but the 80% would be measured on a smaller segment of the timeline. That’s exactly what scale-invariance says to look for.
What could trigger such a mini-crash?
There’s a long list of potential catalysts, including delays and disappointments with Trump’s economic plans, aggressive rate hikes by the Fed, a stronger dollar, and economic turmoil due to China’s vanishing reserves, a new Greek bailout or rising geopolitical tensions.
The cause of the bubble burst is less important than the initial condition of the bubble. The stock market is exhibiting a small-scale bubble formation ready to burst at the first sign of stress.
This is not the “mother of all bubbles.” That may come in time. For now, it’s a clear “mini-bubble” that exhibits the same dynamics as a larger bubble, but on a smaller scale.
Bond market signals are contradicting signals from the stock market, which recently had the most consecutive days of new highs since 1987.
In effect, the stock market is betting on stronger growth, while the bond market is betting on economic cooling.
The bond market has a much better track record of predicting economic turns than the stock market. This recent bond market rally suggests stocks are due for a correction.
Many consider gold the ultimate safe haven asset. And all these factors have increased the attraction of gold as a safe haven asset.
Regards,
Jim Rickards
for The Daily Reckoning
<<<
By James Rickards
March 8, 2017
https://dailyreckoning.com/mini-bubble-burst-moment/
This Mini-Bubble Could Burst at Any Moment
Whenever stocks rise sharply for a sustained period, or rise more than a few days or weeks in a row, as had been the case until these past few days, there is always some pundit quick to label the trend a “bubble” and advise investors to run for the exits.
Usually the pundits are wrong. Most so-called bubbles are not bubbles at all, they’re just short-term trends driven by sentiment or momentum. Those trends may slow down or even reverse, but they don’t burst catastrophically the way real bubbles do.
So pundits who yell “bubble” too often are marginalized as doom-and-gloomers, perma-bears, or the boy who cried wolf.
Yet bubbles are real.
They do burst suddenly and catastrophically, and most investors do lose fortunes when they burst. The art of analysis consists of recognizing the difference between real bubbles and mere short-term trends.
My job is to use the right tools to spot real bubbles, and warn readers in time to avoid losses and even make gains as markets are crashing.
U.S. equity markets today are flashing red when it comes to bubble potential.
True bubbles happen for a variety of fundamental and psychological reasons. Below are two of the most famous stock charts in history.
Chart 1 traces the Japanese stock bubble of 1983 to 1989, which resulted in a spectacular collapse of the Nikkei 225 Index beginning on January 1, 1990.
Famously, that Japanese bubble included real estate as well as stocks. In 1989, the land inside the Imperial Palace Walls in central Tokyo (a three-mile circumference) was said to be worth more than all the land in California.
At the end of Japan’s lost decade, the Nikkei Index stood almost 75% below the peak it reached in late 1989.

Chart 2 is the U.S. stock bubble of the “Roaring Twenties” as shown in the Dow Jones Industrial Average. That crash began on October 24, 1929 (“Black Thursday”) and reached a crescendo on October 29, 1929 (“Black Tuesday”).
The 1929 crash ushered in the Great Depression, which persisted until 1940. At the lows, the Dow Jones index had fallen more than 85% from the 1929 high. Stocks did not recover their pre-crash levels until 1954, a full quarter-century after the crash.

The bubble dynamics are easily seen from these charts. Bubbles do not emerge from depressed conditions or prior collapse. The memories of prior losses are usually enough to prevent investors from engaging in bubble behavior.
Instead, bubbles follow periods of growth and persistent stock market gains. The original stock gains are based on fundamentals. Japan in the 1980s and the U.S. in the 1920s were both highly productive and fast-growing economies. Stock market gains made perfect sense.
Bubbles emerge at the end of long expansions when memories of the last crash fade, and euphoria replaces common sense. At that stage, the slope of the market index curve steepens at an accelerating rate.
The chart no longer rises gently; it rises vertically in a hyperbolic fashion. The result is the famous “hockey stick” image of a gently sloping base with a steeply sloping handle. That is visible in both Chart 1 and Chart 2.
The other characteristic of bubbles is that they persist much longer than many observers expect. It would have been easy (and not wrong) to yell, “bubble” in the U.S. in late 1928 or in Japan in late 1988. Yet markets powered higher despite the warnings. Those who issue early warnings are regarded as cranks. Those who short the market too soon can lose their shirts. Yet, those issuing warnings ultimately proved correct.
The Dow is up over 25% and the S&P 500 is up over 20% over the past year. More than half the gains for both indices were realized in the 3 ½ months since Donald Trump’s election as president:

Is the stock market in a bubble now? Has the “Trump Trade” resulted in the same bubble dynamics we saw in 1929 and 1989?
Superficially, Chart 3 does not exhibit the extreme hockey stick behavior of Charts 1 and 2. It’s true that stocks have been rallying since Trump’s election. But Chart 3 covers only a one year period, compared with the five year build-up to the 1929 and 1989 crashes. This goes to the point that bubbles persist much longer than investors expect.
Based on the history of 1929 and 1989, an analyst might expect a bubble bursting in 2020 from a level of Dow 50,000! That might even be a good prediction, but investors who sit on the sidelines until 2020 could miss the greatest market rally in history.
But, there’s a lot more to dynamic systems analysis than superficial chart comparisons. For a short-term prediction, it’s helpful to utilize the concept of scale-invariance. This concept applies to complex systems such as capital markets, and derives from fractal mathematics.
Scale-invariance simply means that the same patterns repeat themselves at all scales large and small.
The images below are a good example of scale-invariance in nature. If you look at the leaf on the left, you’ll notice that the individual petals on the leaf are exact replicas of the leaf as a whole. Look closer and you’ll see that the petals have separate offshoots that are exact replicas of the petal, and so on. The basic shape of the leaf repeats itself at progressively smaller scales.

The same is true in the spiky bush on the right. You’ll notice that the pattern of large spikes with small spikes sticking out and smaller spikes sticking out is repeated over-and-over at every scale. Scale-invariance is ubiquitous in nature and can be seen in everything from sand ripples to waves, mountain ranges and the shapes of clouds.
Guess what? Research proves that scale invariance applies to the time series of stock prices also. Stock markets are complex systems that behave just like many natural systems. In fact, stocks markets can be regarded as a “natural” system because their patterns are dictated by human behavior and human nature.
Now take a closer look at the 2016-2017 stock market chart above and isolate the segment for January and February 2017. It closely resembles the pre-crash dynamics of the 1929 and 1989 crashes on a smaller scale. Here’s that segment in isolation:
Patterns in the Stock Market
Scale invariance metrics teach us that there can be many “mini-crashes” that exactly resemble the great crashes on a smaller scale. This is exactly like the small leaf petals that closely resemble the larger leaf in nature.
We don’t have to conclude that the Dow Jones will crash 80% to Dow 4,000 (it might someday, but probably not yet). Scale invariance teaches that a mini-crash could cause the Dow to give up 80% of its gains since January 1, 2017, which would put it down almost 700 points to 19,935.
A comparable drop would push the S&P 500 down 90 points to the 2,260 level. Both corrections would be “80% crashes,” but the 80% would be measured on a smaller segment of the timeline. That’s exactly what scale-invariance says to look for.
What could trigger such a mini-crash?
There’s a long list of potential catalysts, including delays and disappointments with Trump’s economic plans, aggressive rate hikes by the Fed, a stronger dollar, and economic turmoil due to China’s vanishing reserves, a new Greek bailout or rising geopolitical tensions.
The cause of the bubble burst is less important than the initial condition of the bubble. The stock market is exhibiting a small-scale bubble formation ready to burst at the first sign of stress.
This is not the “mother of all bubbles.” That may come in time. For now, it’s a clear “mini-bubble” that exhibits the same dynamics as a larger bubble, but on a smaller scale.
Bond market signals are contradicting signals from the stock market, which recently had the most consecutive days of new highs since 1987.
In effect, the stock market is betting on stronger growth, while the bond market is betting on economic cooling.
The bond market has a much better track record of predicting economic turns than the stock market. This recent bond market rally suggests stocks are due for a correction.
Many consider gold the ultimate safe haven asset. And all these factors have increased the attraction of gold as a safe haven asset.
Regards,
Jim Rickards
for The Daily Reckoning
<<<
Join the InvestorsHub Community
Register for free to join our community of investors and share your ideas. You will also get access to streaming quotes, interactive charts, trades, portfolio, live options flow and more tools.

