


Saturday, March 04, 2017 6:00:00 PM
Today I've said "possible Friday effect" a lot more than normally. So after seeing weakening and/or mixed indications I ended up deciding that I should wait a day or two before giving up on my recent (and unusual!) bullish outlook. I hope that doesn't prove to be a big mistake.
Today's trading was quite volatile for the earliest period, making the day's high and low at 9:30 and 9:33 respectively.
I recognized (actually, guessed would be more accurate) from the b/a spread just before open that we were likely to have another "open high and fall" behavior. I had prepared some orders just above the bid and submitted them about 30 second before trading opened. Got my trading shares, 2.7K, for $0.7302, 1/100th of a penny off the low.
By 9:45 things settled into the fairly normal extremely low/no-volume wide-spread flattish trading through ~10:30. The lows then began rising and by ~11:15 we had recovered a common ~1/2 the range and entered a very narrow spread flat period through ~13:15. A small bump up was followed by another flat period until just before 14:00. Then the fairly common drop about a penny above the low occurred. Trade was flattish around $0.74/5 until 15:05 approached the day's low, doing $0.7330. That led to an extremely low/no-volume wide-spread $0.74/$0.765 through 15:30ish. The lows moved up and $0.75/6 extremely low/no-volume led to the close at $0.76.
There were no pre-market trades.
B/a just before open was 100:500 $0.7301/$0.8399.
09:30-09:45 opened the day with a 1,543 buy for $0.7980 & $0.7301 x 20. B/a just after open was 100:1.2K $0.7800/$0.80. Then came 9:31's 120 $0.78, 9:32's b/a 4:800 $0.7750/$0.7999, 9:33's 32.2K (incl my 2.7K buy $0.7302) $0.75/$0.7415/0002 (2.7K)/$0.7308/02 (17K blk)/01/$0.7962, 9:36's 400 $0.7308/7/$0.77 (200), 9:37's 100 $0.7350, 9:42's b/a 200:629 $0.7451/$0.76, 9:42's 100 $0.7454, and the period ended on 9:45's 100 $0.7541.
9:46-10:38 began extremely low/no-volume $0.74/$0.7541 (initially lots of 100-share-pecking of bids) on 9:46's 4.3K $0.7541 (1.9K)/$0.7508 (2K)/00. B/a at 9:49 was 900:1.6K $0.7500/84, 9:52 800:1.7K $0.7500/74, 10:02 500:400 $0.7400/$0.7558. Range expanded to $0.74/$0.7558 at 10:11. B/a at 10:13 was 500:600 $0.74/$0.7558, 10:17 500:600 $0.74/$0.7558. Price and volume were interrupted by 10:27's 1.2K $0.7521/$0.7332 (even though bid was still $0.74 - must be an intra-broker trade?). That engendered falling highs, down to $0.75 by 10:31. B/a at 10:29 was 419:600 $0.74/$0.7558, 10:38 419:900 $0.7400/98. The period ended on 10:38's 8.5K $0.7477/39/77/00/7739/77$0.75/$0.7450/$0.75/$0.7479.
10:39-11:10 began very low/no-volume $0.7529/58, with slowly falling highs, after 10:39's 100 $0.7552, 10:42's 2.4K $0.7500/05, 10:41's b/a of 1.6K:900 $0.7500/56, 10:47 783:400 $0.7500/58, and 10:44's 10.7K $0.7427/45/88/90/93/47/93/25/68/47/25/93/68/47/93/25/68/47/25/47/9425/69/5026/$0.75/$0.7475/50$0.75/$0.7426/75/$0.75/$0.7479/54. B/a at 11:01 was 683:1.3K $0.7500/48, 11:07 100:5.1K $0.7560/$0.77 (bids backed by presented 18.6K $0.7537 - west coasties arrival? 18.6K qualifies as "larger" quantity.). The period ended on 11:10's 800 $0.7560/72.
11:11-13:49, after the first four no-trades minutes when b/a at 11:14 was 100:5.6K $0.7560/$0.77 (bids still backed as before), trade began extremely low/no-volume (no trades 11:16-11:54) $0.7560/$0.7615 on 11:15's 100 $0.7615. B/a at 11:18 was 200:5.7K $0.7599/$0.77 (bids still backed as before), 11:32 200:5.7K $0.7599/$0.77 (bids still backed as before), 11:47 200:1.8K $0.7599/$0.7698 (bids still backed as before). The no-trades period was finally broken by 11:54's931 $0.7607/15 but then there were no-more trades 12:12-13:11. B/a at 11:59 was 200:1.2K $0.7599/$0.7698 (bids still backed as before), 12:17 100:900 $0.7615/97 (bids still backed as before), 12:31 100:1K $0.7615/97, 12:46 100:500 $0.7615/96 (bids still backed as before), 13:02 100:1.2K $0.7615/97 (bids still backed as before). 13:12's 700 $0.7685 broke the no-trades hour. B/a at 13:16 was 100:1.3K $0.7615/78 (bids still backed as before but someone moved as quantity was now ~14K), 13:32 200:1.8K $0.7615/68 (offers falling). Volume was interrupted by 13:40's 3.4K $0.7643/74/... 75/43/76/75/54. Volume picked up and range became $0.7643/96. Shortly after, the offers began to move lower. B/a at 13:47 was 66:1K $0.7664/97 (bids still backed as before but ~14K). The period ended on 13:49's 6.7K $0.7696 (6.6K)/53.
13:50-14:23, after an initial extremely low/no-volume $0.7615/96 with b/a at 14:02 of 200:1.5K $0.7610/46 (offers falling), trade began a move lower from 13:54's 6.1K $0.7615/16 on 14:04-:05's 6.1K $0.7639/18/56/33/64/10, did 14:12's 9.3K $0.7629/10/$0.7599, 14:15's 200 $0.7560/59, 14:17's100 $0.7609, 14:18's b/a 800:1.3K $0.7560/$0.7607, 14:18's 1.2K $0.7560, 14:20's 17.1K $0.7560 (incl 16.3K blk)/55/00, and the period ended on 14:23's 1.3K $0.75/$0.7410.
14:24-15:05, after seven no-trades minutes began extremely low/no-volume $0.7499, slowly stepping down, on 14:31's 100 $0.7499. B/a at 14:32 was 500:1.3K $0.7450/99. 14:42's 2K did $0.7499->$0,745. B/a at 14:51 was 3K:2.9K $0.7410/84. 14:58's 1K did $0.7410. B/a at 15:02 was 2K:800 $0.7410/99. The period ended on 15:05's 2.2K $0.74->$0.7330->$0.7331.
15:06-16:00 began an extremely low/no-volume, wide spread $0.7401/$0.7650 after 15:06's 6.8K $0.7331/0/$0.7648 and 15:08's 5.1K $0.7461->$0.7401. B/a at 15:16 was 200:300 $0.7403/$0.7650, 15:32 600:100 $0.7403/$0.7640. 15:33's 100 $0.764 moved the range to $0.763/5, still with almost no volume. B/a at 15:46 was 1.1K:500 $0.7403/$0.7650. Price held fairly well into the close, $0.7599/$0.76, and the period and day closed on 15:59's 700 $0.7599/$0.76/$0.7599 and 16:00's 429 share sell for $0.76.
There were no AH trades.
Excluding the opening and closing trades (didn't qualify), there were 7 larger trades (>=5K) totaling 61,312, 39.79% of day's volume, with a $0.7492 VWAP. For the day's volume, the count seems reasonable but the percentage of day's volume is high. The VWAP is only marginally below the day's $0.7515.
As with yesterday, I think we can consider them equivalent. Unlike yesterday, only ~33% of the day's volume, in the periods ending 10:38 and 11:10, had a similar VWAP.
The period before, when I got my 2.7K for $0.7302 thanks to guessing right that we'd get a typical "open high and fall", had a much lower VWAP, and the following periods had higher VWAPs. I suspect these later periods are reflective of the new short-term(?) bullishness that seems to be creeping into the market. Higher VWAPs wouldn't normally be what I would expect if it was shorters or MMs covering.
That first period was a killer today! If it had begun the day with something even as low as 10%-15% (and something higher would be more normal) the progression we see later could have led to an EOD value in the high 40% to low 50% range, which would offer some support to yesterday's bullish assessment. Having said that, keep in mind that today may have been a "Friday effect", suggested by the low volume and the intra-day extremely low/no-volume long flattish periods for a great part of the day.Ending Period Period Period __Per. Trade_ Period_ % Day_ Per. End
Period Volume Low High _Dollar Val._ VWAP___ Volume Buy ~%
09:45 34955 $0.7301 $0.7980 $25,825.16 $0.7388 22.69% 5.80% Incl 09:33 $0.7302 17,000 $0.7400 5,000
10:38 18608 $0.7332 $0.7558 $13,950.03 $0.7497 12.08% 22.43%
11:10 17078 $0.7425 $0.7572 $12,797.58 $0.7494 11.08% 32.01%
13:49 13601 $0.7607 $0.7696 $10,442.38 $0.7678 8.83% 39.00% Incl 13:49 $0.7696 5,000
14:23 41400 $0.7410 $0.7664 $31,436.34 $0.7593 26.87% 35.74% Incl 13:54 $0.7616 5,534 14:12 $0.7629 7,500
14:20 $0.7560 16,278
15:05 9419 $0.7330 $0.7499 $6,995.83 $0.7427 6.11% 36.49%
16:00 17629 $0.7330 $0.7650 $13,297.52 $0.7543 11.44% 37.47% Incl 15:08 $0.7461 5,000
On the traditional TA front, movements were:
The high and close could've been better. Maybe a "Friday effect" as the volume might suggest? Even so, the close was on down 9/10ths of a penny and the high a bit more at 12/100ths of a penny. If we have begun a bullish move, not significant. If we haven't then tomorrow should back up these figures with another negative cast.__Open_ ___Low_ __High_ _Close_ Volume_
Today 6.67% 0.01% -1.48% -1.17% -26.34%
Prior 0.13% -0.12% 6.58% 2.51% 57.23%
On my minimal chart, recall that yesterday we confirmed a breakout above the longer-term descending resistance (red line) on rising volume. Price also broke above the descending short-term resistance, falling orange line. We also remained completely above the short-term rising support, the rising orange line.
Today we confirmed a break above that descending short-term resistance and the low touched all three of those lines and rebounded to close well above all of them, but on descending and low volume. The volume may be a "Friday effect", so I'm not going to (yet) get in a tizzy thinking the bullishness indicated yesterday was a false signal.
I'm thinking the intra-day behavior, which started with an "open high and drop" behavior, that showed price recovery from the early weakness with improving, albeit low, buy percentage is suggesting that the bullishness is still there and the weakness of today is indeed a "Friday effect".
The fast EMA (yellow squiggly line) continues rising but is still below, but even less so than yesterday, the slow EMA (squiggly blue line). We get a bullish indication when it crosses above and holds. If we get any bullishness continuation over the next couple days we should get a bullish cross out of these EMAs.
Our trade range, which yesterday almost completely filled the range of the experimental 13-period Bollinger band, did so again today but at a slightly lower position within the range. The low remained above the lower limit, so we aren't "pushing" it. As with yesterday, the lower limit rising slightly faster than the upper limit declines gives a rising mid-point and we should see a small benefit from the slightly rising mid-point. It only suggests less likelihood of substantial down-side for now.
On my one-year chart, the long-term descending resistance, which was still applying pressure, was penetrated yesterday as price closed above it. Today it appears, as near as I can tell, that our close was right on it. For that reason I'm not yet going to call a confirmed breakout. With any luck we'll get that tomorrow. It may have been prevented today by the low volume, maybe a "Friday effect".
The 50 and 200-day SMAs continue falling. The 20-day SMA and the 10-day continued to decline and the 10-day is still above the 20-day. The spread between them, which had loosened a bit, tightened up some and the 10-day is a bit more likely to quickly get below the 20 if weakness appears. If we hold here we'll get 4 (was 2) days of declining 10-day SMA and 4 days of rise. The 20-day would have 1 (was 1) day of decline and six days of rise. If we hold here the 50 would decline 4 (was 1) days and then begin to rise for 15 (was 26) days, with a one-day interruption. The 200-day would fall ~165 (was ~150) days.
Yesterday the oscillators I watch had weakening in accumulation/distribution and MFI (untrusted by me) and improvement in RSI, momentum, Williams %R, full stochastic, and ADX-related.
Today had weakening in RSI (right at neutral), accumulation/distribution, Williams %R (below neutral) and ADX-related. Improvement occurred in MFI (above neutral and untrusted by me), momentum (just below neutral) and full stochastic (just above neutral).
The experimental 13-period Bollinger limits, $0.7264 and $0.8119 ($0.7193 and $0.8143 yesterday), continued converging. The mid-point is marginally rising as the lower limit rises more quickly than the upper limit declines.
All in, if it weren't for the possible "Friday effect" I'd say we were giving up some of the bullish indications. But that effect often results in weakening in price and volume, both of which were observed today. For that reason I'm going to defer changing from my bullish assessment until some confirmation that it's warranted in the next day or two.
Percentages for daily short sales and buys moved in the same direction, good, but both percentages are in "not good" territory. There's no way to assess if this is a "Friday effect" or not. The buy percentage is edging closer to my desired normal range (needs re-check) and, as mentioned above, the buy percentage ended much lower than would have been anticipated if the early trading had resulted in a more normal early reading of at least 10-15%. Given that, I'm not going to give too much weight to the buy percentage today.
The spread contracted a bit but is still in a range suggesting that movement is likely. With the recent short-term trend of generally higher highs and lows I think the trend we're in is an up trend and this wider spread would suggest that the most likely near-term behavior is continued upward. However, it was produced almost exclusively by a volatile early trading profile with the rest of the day much more flattish. For that reason I would discount it quite a bit today - a more normal trading day would likely have a much smaller spread, unless we had a strong bearish or bullish behavior, such as yesterday's. I'm suspecting today was a "Friday effect".
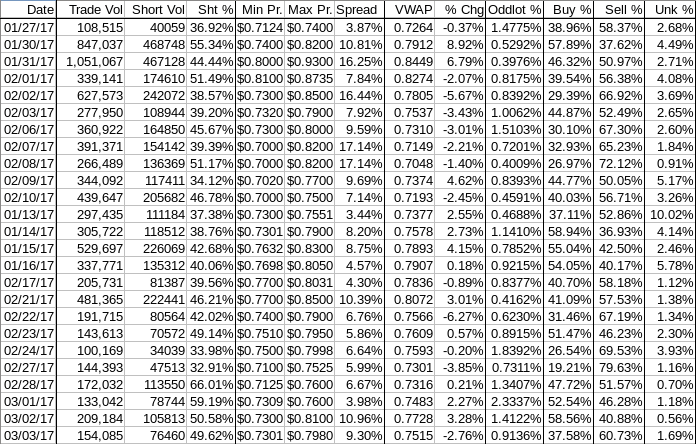
The VWAP's last twenty-four readings held steady for the seventh day at 12 negative and 12 positive. Change since 01/27 is $0.0251, 3.45%, and the averages of the rolling 24-day period seen in the last few days (latest first) are now 0.2106%, 0.3104%, 0.2341%, 0.2301%, 0.3382%, 0.4031%, 0.3941%, 0.2967%, 0.4694%, and 0.3371%.
All in, the most positive thing today is the continued positives in the 24-period averages of VWAP changes. The other items are either not that great or are suspect due to a possible "Friday effect".
Given that I'll hold with yesterday's bullish assessment until we get a day or two of something that seems more reliable.
Bill
Join the InvestorsHub Community
Register for free to join our community of investors and share your ideas. You will also get access to streaming quotes, interactive charts, trades, portfolio, live options flow and more tools.

