==> Swenlin Trading Oscillators Very Bearish By Erin Heim
* February 18, 2017
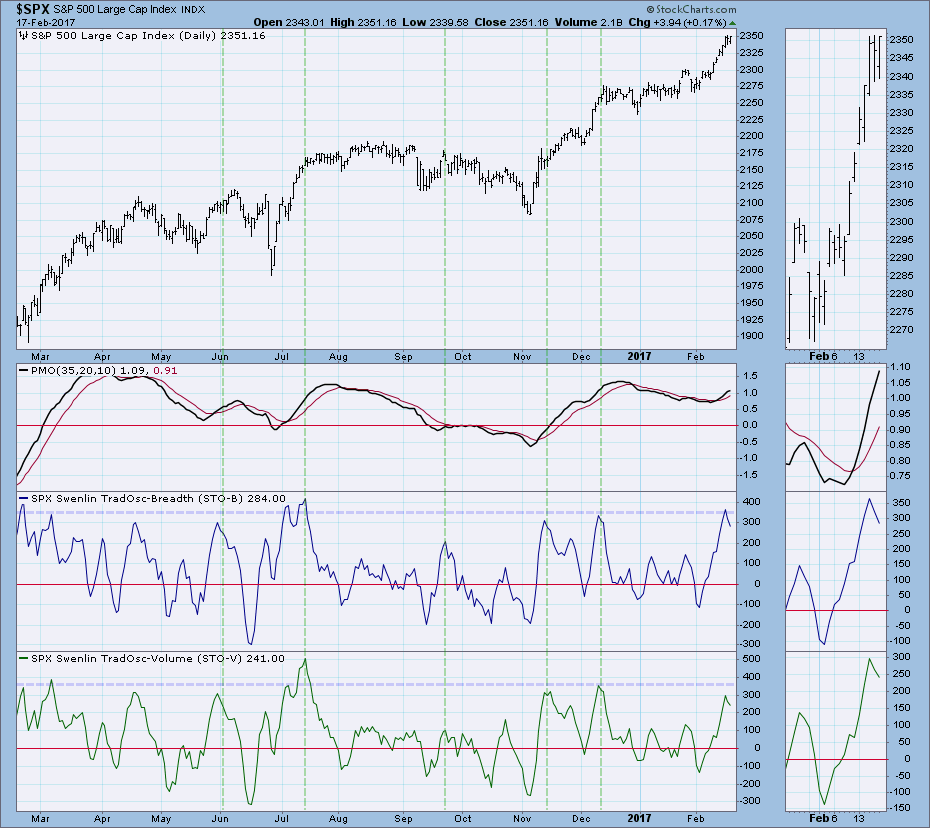
The market has been experiencing an almost vertical rally over the past few weeks, but it has cooled over the past two days. The steep rising trend pushed our short-term Swenlin Trading Oscillators (STOs) into highly overbought territory. With Thursday and Friday's cooling off period, they have peaked. This is a very bearish configuration.
I've highlighted overbought extremes for the STOs in blue on the SPX chart below. You can see how the readings shot higher during the rally and have topped. I've drawn vertical lines showing that most of these overbought peaks do result in a downtrend. The November top on the STOs turned out to be more of an initiation flag rather than exhaustion alert and there are parallels.
The November rally was mostly fueled by the election of a pro-business president. The peak came after a pause in the action for price. The market continued to rally after the STO peaks because the news during the transition period continued to suggest a pro-business stance. They turned out to be an initiation until the exhaustion and the next peak.
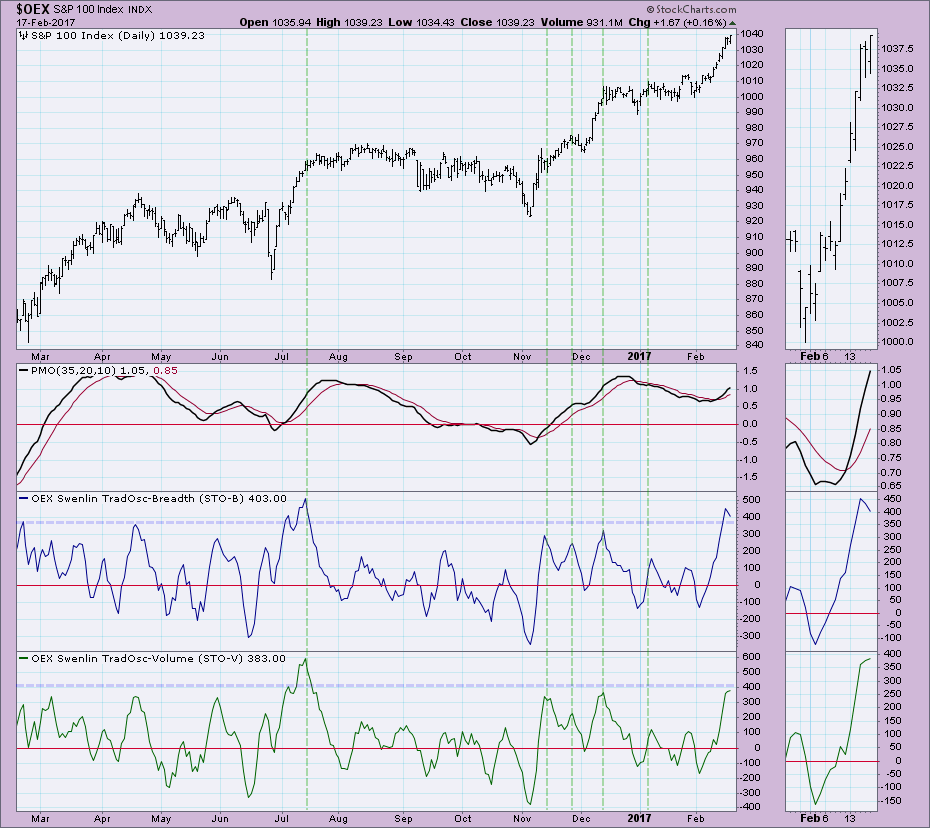
The STOs on the S&P 100 are even more overbought than on the SPX above. Also note that the STO-V hasn't actually peaked yet. When it does, it will be in highly overbought territory.
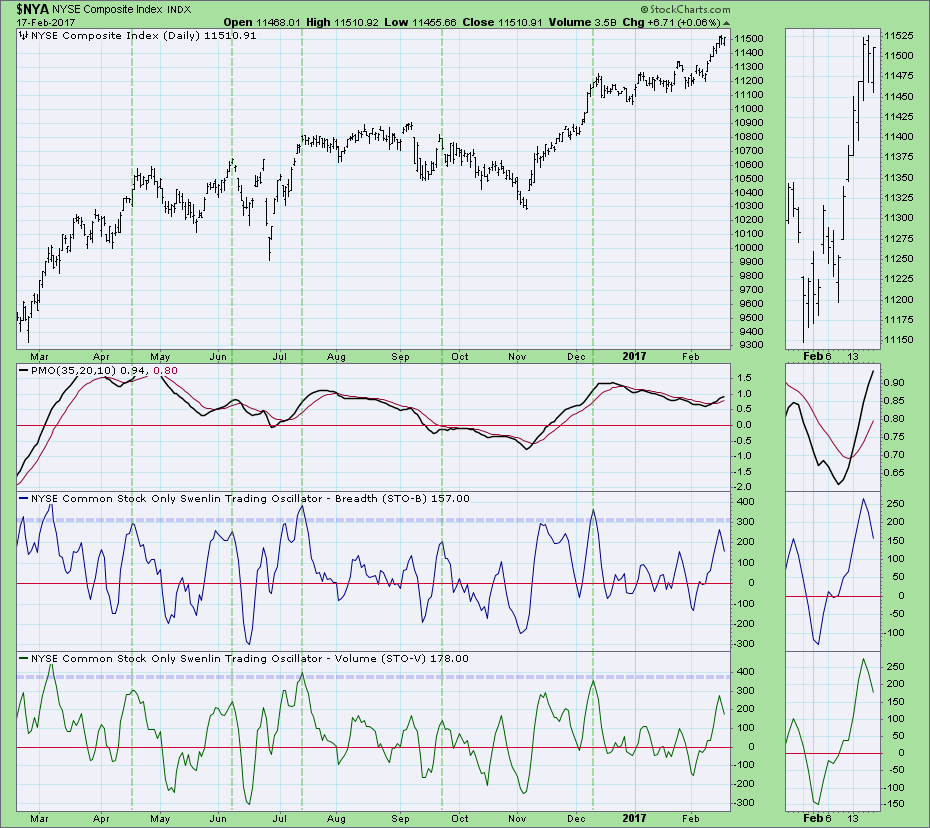
On the NYSE, the peak in November reacted as the others above with an initiation rather than an exhaustion. However, most of these peaks result in at least sideways consolidation and not a rally.
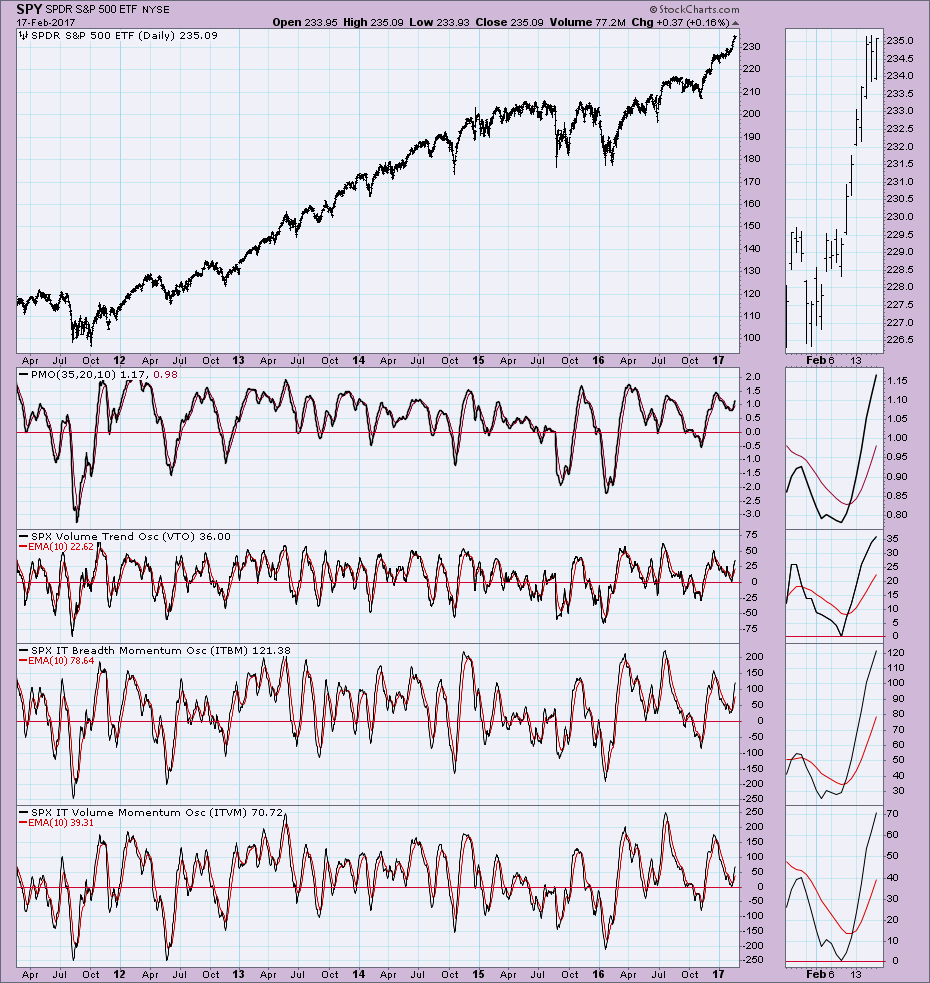
Typically very overbought peaks are a very bearish sign that the market is ready to experience a correction, decline or consolidation. I believe that this is the case right now, but there is one foil to the plan -- last November. The current rally doesn't seem organic; meaning, it has likely been fueled by pro-business executive orders and tax teases. This is very similar to the agreed reasons for the November rally. Therefore, this could turn out to similarly be an initiation to higher prices. Intermediate-term indicators, the Volume Trading Oscillator (VTO), Intermediate-Term Breadth Momentum oscillator (ITBM) and Intermediate-Term Volume Momentum (ITVM) are very bullish right now so an initiation climax to higher prices is not out of the question. Notice in the chart below that all of the IT indicators bottomed in positive territory and have begun rising strongly.
Conclusion: So why do you ask am I reading these indicators as bearish. I'm not advocating that we will see a serious correction in the short term. Intermediate-term indicators are too bullish, but more often than not, a consolidation period or a pullback results after overbought STO peaks so that should be our expectation.
Technical Analysis is a windsock, not a crystal ball.
Click on "In reply to", for Authors past commentaries
Information posted to this board is not meant to suggest any specific action, but to point out the technical signs that can help our readers make their own specific decisions. Your Due Dilegence is a must! • DiscoverGold
Register for free to join our community of investors and share your ideas. You will also get access to streaming quotes, interactive charts, trades, portfolio, live options flow and more tools.


 News
News  Market Data
  Discover