


| Followers | 679 |
| Posts | 140788 |
| Boards Moderated | 36 |
| Alias Born | 03/10/2004 |
Saturday, February 18, 2017 10:43:36 AM
==> Peek Into Future Through Futures
* February 18, 2017
Following futures positions of non-commercials are as of February 14, 2017.
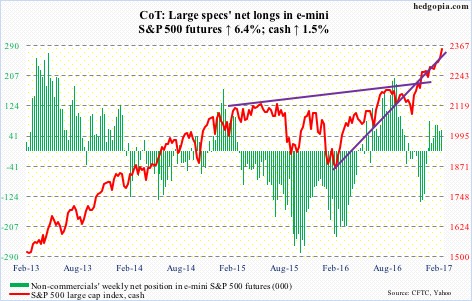
E-mini S&P 500: In the first three sessions this week, the cash rallied 1.4 percent. The move was nicely aided by inflows. SPY, the SPDR S&P 500 ETF, attracted $4.6 billion in those three sessions. In the week through Wednesday, the ETF took in $3.2 billion, which followed a loss of $3 billion in the prior week (courtesy of ETF.com).
In the same week, U.S.-based equity funds attracted $11.5 billion. This is in addition to $16.2 billion in the prior two (courtesy of Lipper). Importantly, post-November 8 U.S. presidential election, these funds took in $42.1 billion, and SPY $18.3 billion.
Behind the nearly 10 percent rally in the cash since the election, it is not just short squeeze. Flows are cooperating as well. Investor/trader expectations have gone up big time. This week, Investors Intelligence bulls continued to remain north of 60 percent (61.8 percent) – with five of the last seven in the 60’s and north of 50 in the last 13 weeks!
The balance is tilted way too much to the optimistic side. That said, momentum is intact. In times like these, it always helps to be on the lookout for reversal signs.
Currently net long 57.8k, up 3.5k.
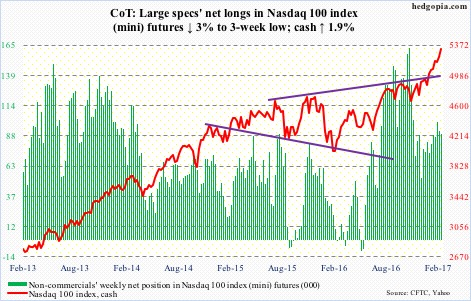
Nasdaq 100 index (mini): The cash enjoyed its seventh consecutive weekly rallies. The last time the index rallied for such a long stretch was in June-August last year. Back then, the stretch ended there, before dropping three-plus percent in the next five.
As relentless as the current rally has been, momentum is yet to crack, with shorter-term moving averages sharply rising – nearly parabolic.
Both this week and last week, the Nasdaq 100 rallied in the face of outflows from QQQ, the PowerShares Nasdaq 100 ETF. In the week ended Wednesday, $527.1 million left, following redemptions of $819.1 million in the prior week (courtesy of ETF.com).
For whatever it is worth, a long-legged doji showed up on Apple (AAPL) on Wednesday. Remains to be seen if the bears can make something out of it.
Currently net long 89.7k, down 2.7k.
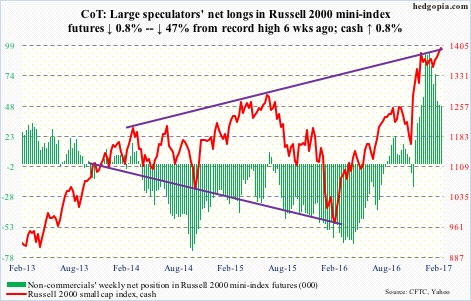
Russell 2000 mini-index: Finally, a breakout, albeit a meek one. And a new high (1405.21). After going sideways in a rectangle/flag formation for nine weeks, the cash broke out Tuesday, followed by breakout retest on Wednesday through Friday. Ideally, technicians would be eyeing a measured-move target of 1440-ish.
However, considering how extended the Russell 2000 is, the best the small-cap bulls can hope for near term is a retrenchment and then a successful retest of 1347 support, before rallying again.
Flows continue to be off and on, and that needs to change. In the week ended Wednesday, $280 million moved into IWM, the iShares Russell 2000 ETF, following outflows of 1.1 billion in the prior week (courtesy of ETF.com).
Currently net long 48.7k, down 380.
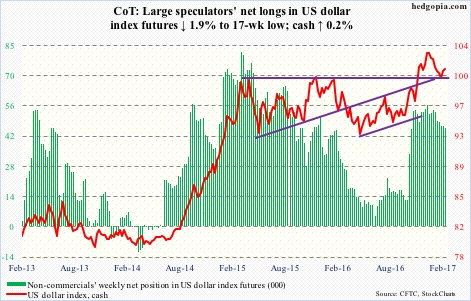
US Dollar Index: Wednesday, the cash tried to retake the 50-day moving average, but was rejected. The slight weakness since preceded 10 straight up sessions.
The dollar index could very well be forming the right shoulder of a head-and-shoulders formation, which, if completes, would be bearish. Support at 99-plus is a must-save. The neckline lies a little above that.
Currently net long 45.9k, down 872.
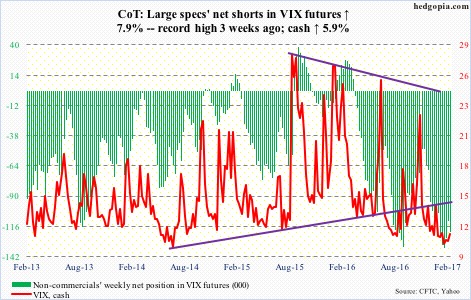
VIX: It is not often both the S&P 500 and VIX rally together. Yet that is what happened this week, with VIX up 5.9 percent and the S&P 500 up 1.5 percent.
With stocks rallying right from the word go, the week started out normal as far as volatility went; VIX was rejected at 10- and 20-day moving averages. Things changed on Wednesday, when it shot up 11.5 percent – past its 50-day; the S&P 500 rallied 0.5 percent in that session! There were all kinds of theories making the rounds for this odd behavior, including one that blamed a failing hedge fund for this.
Whatever the reason, that protection-buying did not sustain. By Friday, VIX was back below 50-day.
This oddity was also reflected in the VIX-to-VXV ratio, as it pushed higher to .84. Apparently, VIX (30-day volatility) rallied more than VXV (three months). Leading up to this, the ratio lingered in the .70s for six straight weeks – and in 10 out of 12.
One more example of the current giddy sentiment: the CBOE put-to-call ratio in the .50s the past four sessions.
Currently net short 120.7k, up 8.9k.
http://www.hedgopia.com/cot-peek-into-future-through-futures-83/
• DiscoverGold
Click on "In reply to", for Authors past commentaries
* February 18, 2017
Following futures positions of non-commercials are as of February 14, 2017.
E-mini S&P 500: In the first three sessions this week, the cash rallied 1.4 percent. The move was nicely aided by inflows. SPY, the SPDR S&P 500 ETF, attracted $4.6 billion in those three sessions. In the week through Wednesday, the ETF took in $3.2 billion, which followed a loss of $3 billion in the prior week (courtesy of ETF.com).
In the same week, U.S.-based equity funds attracted $11.5 billion. This is in addition to $16.2 billion in the prior two (courtesy of Lipper). Importantly, post-November 8 U.S. presidential election, these funds took in $42.1 billion, and SPY $18.3 billion.
Behind the nearly 10 percent rally in the cash since the election, it is not just short squeeze. Flows are cooperating as well. Investor/trader expectations have gone up big time. This week, Investors Intelligence bulls continued to remain north of 60 percent (61.8 percent) – with five of the last seven in the 60’s and north of 50 in the last 13 weeks!
The balance is tilted way too much to the optimistic side. That said, momentum is intact. In times like these, it always helps to be on the lookout for reversal signs.
Currently net long 57.8k, up 3.5k.

Nasdaq 100 index (mini): The cash enjoyed its seventh consecutive weekly rallies. The last time the index rallied for such a long stretch was in June-August last year. Back then, the stretch ended there, before dropping three-plus percent in the next five.
As relentless as the current rally has been, momentum is yet to crack, with shorter-term moving averages sharply rising – nearly parabolic.
Both this week and last week, the Nasdaq 100 rallied in the face of outflows from QQQ, the PowerShares Nasdaq 100 ETF. In the week ended Wednesday, $527.1 million left, following redemptions of $819.1 million in the prior week (courtesy of ETF.com).
For whatever it is worth, a long-legged doji showed up on Apple (AAPL) on Wednesday. Remains to be seen if the bears can make something out of it.
Currently net long 89.7k, down 2.7k.

Russell 2000 mini-index: Finally, a breakout, albeit a meek one. And a new high (1405.21). After going sideways in a rectangle/flag formation for nine weeks, the cash broke out Tuesday, followed by breakout retest on Wednesday through Friday. Ideally, technicians would be eyeing a measured-move target of 1440-ish.
However, considering how extended the Russell 2000 is, the best the small-cap bulls can hope for near term is a retrenchment and then a successful retest of 1347 support, before rallying again.
Flows continue to be off and on, and that needs to change. In the week ended Wednesday, $280 million moved into IWM, the iShares Russell 2000 ETF, following outflows of 1.1 billion in the prior week (courtesy of ETF.com).
Currently net long 48.7k, down 380.

US Dollar Index: Wednesday, the cash tried to retake the 50-day moving average, but was rejected. The slight weakness since preceded 10 straight up sessions.
The dollar index could very well be forming the right shoulder of a head-and-shoulders formation, which, if completes, would be bearish. Support at 99-plus is a must-save. The neckline lies a little above that.
Currently net long 45.9k, down 872.

VIX: It is not often both the S&P 500 and VIX rally together. Yet that is what happened this week, with VIX up 5.9 percent and the S&P 500 up 1.5 percent.
With stocks rallying right from the word go, the week started out normal as far as volatility went; VIX was rejected at 10- and 20-day moving averages. Things changed on Wednesday, when it shot up 11.5 percent – past its 50-day; the S&P 500 rallied 0.5 percent in that session! There were all kinds of theories making the rounds for this odd behavior, including one that blamed a failing hedge fund for this.
Whatever the reason, that protection-buying did not sustain. By Friday, VIX was back below 50-day.
This oddity was also reflected in the VIX-to-VXV ratio, as it pushed higher to .84. Apparently, VIX (30-day volatility) rallied more than VXV (three months). Leading up to this, the ratio lingered in the .70s for six straight weeks – and in 10 out of 12.
One more example of the current giddy sentiment: the CBOE put-to-call ratio in the .50s the past four sessions.
Currently net short 120.7k, up 8.9k.

http://www.hedgopia.com/cot-peek-into-future-through-futures-83/
• DiscoverGold
Click on "In reply to", for Authors past commentaries
Information posted to this board is not meant to suggest any specific action, but to point out the technical signs that can help our readers make their own specific decisions. Your Due Dilegence is a must!
• DiscoverGold
Join the InvestorsHub Community
Register for free to join our community of investors and share your ideas. You will also get access to streaming quotes, interactive charts, trades, portfolio, live options flow and more tools.

