Sunday, February 12, 2017 9:55:04 AM
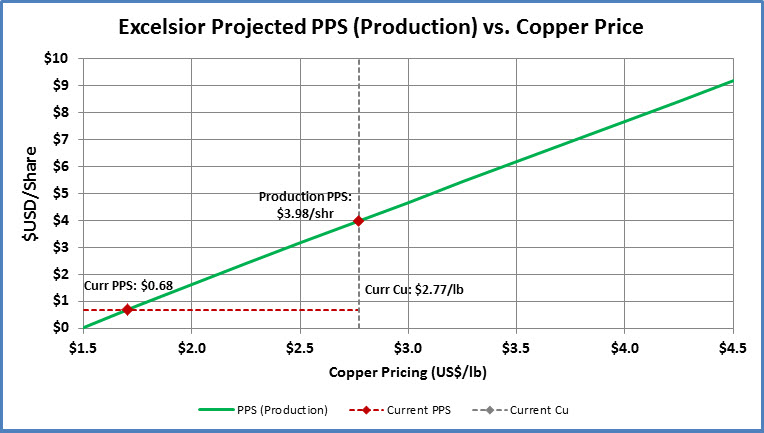
Here is a modified PPS Projection Chart that highlights how undervalued MIN presently is compared to the value it will be when production is achieved. Please keep in mind that Excelsior will very likely be in production by mid-2018!
The PPS line is based on value at production with respect to copper pricing.
Assumptions:
1. Fully-diluted number of shares: 200M shares
2. Current copper priced at $2.77/lb
3. Current MIN PPS US$0.68/shr
4. Company valuation to 100% of Net Asset Value (NAV).
5. 50/50 split of debt to equity financing for the initial capex raise.
6. Includes debt repayments (principal+interest).
7. Assumes that capital improvements for Phase II and Phase III will be fully funded from a combination of debt and revenues (no equity).

Axis Technologies Group and Carbonis Forge Ahead with New Digital Carbon Credit Technology • AXTG • Apr 24, 2024 3:00 AM
North Bay Resources Announces Successful Equipment Test at Bishop Gold Mill, Inyo County, California • NBRI • Apr 23, 2024 9:41 AM
Epazz, Inc.: CryObo, Inc. solar Bitcoin operations will issue tokens • EPAZ • Apr 23, 2024 9:20 AM
Avant Technologies Launches Advanced AI Supercomputing Network and Expansive Data Solutions • AVAI • Apr 23, 2024 8:00 AM
BestGrowthStocks.com Issues Comprehensive Analysis of Triller Merger with AGBA Group Holding Limited • AGBA • Apr 22, 2024 1:00 PM
Cannabix Technologies to Present Marijuana Breathalyzer Technology at International Association for Chemical Testing (IACT) Conference in California • BLO • Apr 22, 2024 8:49 AM


