


Thursday, February 02, 2017 10:03:42 AM
>>> This Bond Bull Isn’t Dead Yet
By James Rickards
January 31, 2017
https://dailyreckoning.com/bond-bull-isnt-dead-yet/
This Bond Bull Isn’t Dead Yet
“The bond bull market is over!” How many times have you heard that in the past six months? The past year? Or, for that matter, the past five years?
Time and again, the bond bears have declared the bull market over. They just can’t believe U.S. rates can possibly go lower. Time and again the bears have been proved wrong, and the bond market rally continues.
We may be on the brink of another reversal in temporary bear market conditions. The bond market has been down for the last five months. As bond yields rise, bond prices fall (and vice-versa).
Yields to maturity on benchmark ten-year Treasury notes have backed-up over a full percentage point since their record low of 1.36% in July 2016 shortly after the Brexit shock. They currently trade around 2.4%. This follows the recent high yield of 2.6% in December 2016 after the Trump election victory, and the “Trump Trade” that affected stocks, bonds and currencies.
The bears are unanimous that this breakout in yields — from 1.4% to 2.6% and resulting capital losses to bond holders — is the death-knell for the 35-year old secular bond bull market. Just to put that in perspective, the yield on ten-year Treasury notes hit an all-time high of 15.82% in September 1981.
Yields have tumbled, albeit with zigs and zags and nasty bear markets along the way, for the entire 35-year stretch since then. It’s not unreasonable to estimate that most of the bond traders on Wall Street weren’t even born when this secular bull market began in 1981.
At the 1.4% level reached last summer, it seemed that yields just could not get any lower. Just about all market participants, young and old, were ready to write “RIP” on the bull market, and brace for a new secular bear. Market behavior since then has supported that view.
But the bond bull market may still have legs. As Mark Twain observed after reading a false obituary of himself, “Reports of my death have been greatly exaggerated.” The same might be said for the bond bull market.
Hedge funds and leveraged players look trapped in a massively leveraged short position. They are being set up for slaughter by the real money accounts.
What are the bears missing? The most important thing they are missing is that rates are really not that low to begin with. It’s true that nominal rates have been low, but real rates are nowhere near their all-time lows due to the impact of inflation.
A real rate is simply the nominal rate minus inflation. Prior to the super-spike in yields in 1981, nominal rates were around 13% while inflation was about 15%. This meant that real rates were negative 2%, (13 – 15 = -2).
Today, with nominal T-rates around 2.4% and inflation about 1.6%, the real rate is positive 0.8%, (2.4 – 1.6 = 0.8). Even though nominal rates were 10.6% percentage points higher in 1980, the real rate was 1.2% lower. Since real rates are what determine investment decisions, it’s the case that interest rates are relatively high today.
This simple concept of real versus nominal rates is not discussed much on financial TV or blogs, but it’s a crucial distinction. Simply put, interest rates are still high today and could fall a lot lower.
Another concept missed by the bond bears is velocity. That refers to the turnover of money. It’s also easy to understand. If I have a dollar, go to dinner, tip the waiter, and the waiter takes a taxi home, and the taxi driver buys gasoline, my dollar has velocity of three in the tip, the taxi fare, and the gasoline (1 + 1+ 1 = 3). If I stay home, watch TV, and leave my money in the bank, my money has velocity of zero since it was never spent.
The notional value of GDP is defined as money supply (M) times velocity (V), or M x V = GDP. Bears keep looking at the expanded money supply and expecting inflation right around the corner.
It’s true that the Fed has expanded the money supply enormously since the 2008 crisis. But guess what? Velocity is sinking like a stone. In fact, velocity has been plunging since the 1998 financial crisis due to demographics and lost confidence in money as shown in the chart below.
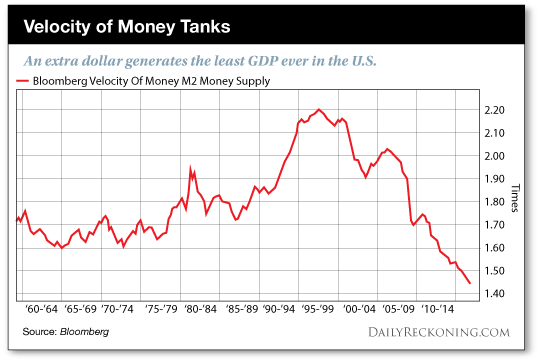
Velocity of Money Tanks
The math is inescapable. If M0 (base money) is $4 trillion and V is zero, then the economy has disappeared; the gross nominal GDP would be zero ($4T x 0 = 0). Of course, that won’t happen (with 0 nominal GDP, we’d all be living in a new Stone Age), but the extreme example makes the point that as long as velocity is plunging, there’s no inflation. And without inflation, real rates will remain high even at very low nominal rates.
It’s not difficult to imagine a U.S. scenario where nominal rates are 0.5%, inflation is negative 1% (called deflation), and real rates are still relatively high at 1.5%, [0.5 – (-1.0) = 1.5].
Indeed, this is precisely the situation that has plagued Japan for decades and appeared in Europe recently. It may be coming to the U.S. also.
The recent back-up in yields looks just like the yield increases in 2013 before they hit a peak and fell sharply.
Far from the start of a bear market, early 2017 looks like early 2014. It’s déjà vu all over again.
What are the reasons for believing that yields actually will decline again as they did in 2014? And why should investors expect a new bond market rally even in the midst of the secular bull market?
•It’s obvious by now that the Trump economic plan will not provide nearly as much stimulus as Wall Street expected immediately after the election. (Something we warned about at the time). The “Trump Trade” could be out of steam and is set for a reversal. That includes a reversal in bond yields.
•Protectionism is on the rise and a full-scale trade war is not far behind. Protection can produce U.S. jobs in manufacturing, but it’s a job killer in aircraft, pharmaceuticals, technology, entertainment, and other sectors. Regardless of the merits for displaced manufacturing workers, protection is a headwind for overall economic growth.
•Excessive debt levels put the U.S. in the danger zone when it comes to growth. Germany’s Angela Merkel says a 60% debt-to-GDP ratio retards growth. That’s the standard the ECB uses for members of the Eurozone. Scholars Ken Rogoff and Carmen Reinhart put the figure at 90%. The U.S. debt-to-GDP ratio is currently at 105%, and heading higher. Under any standard, the U.S. is at the point where more debt produces less growth rather than more. This is one more reason why the Trump infrastructure spending plan will not produce the hoped for growth. With low real growth and low inflation, don’t expect nominal rates to rise much if at all. In fact, expect them to drop.
With the ingredients for lower rates and a bond market rally in place, the most straightforward trade is to go long ten-year Treasury notes.
The problem there is that the Treasury market looks like the Gunfight at the OK Corral. On one side are hedge funds and leveraged players who are massively short bonds. On the other side are real money players like banks and institutions who see what we see.
One side is going to lose big (my view is it will be the hedge funds again), but there could be huge volatility and violent countertrends as the two sides fight it out.
Regards,
Jim Rickards
for The Daily Reckoning
<<<
Join the InvestorsHub Community
Register for free to join our community of investors and share your ideas. You will also get access to streaming quotes, interactive charts, trades, portfolio, live options flow and more tools.

