


| Followers | 679 |
| Posts | 140786 |
| Boards Moderated | 36 |
| Alias Born | 03/10/2004 |
Saturday, January 21, 2017 9:18:50 AM
Peek Into Future Through Futures
* January 21, 2017
Following futures positions of non-commercials are as of January 17, 2017.
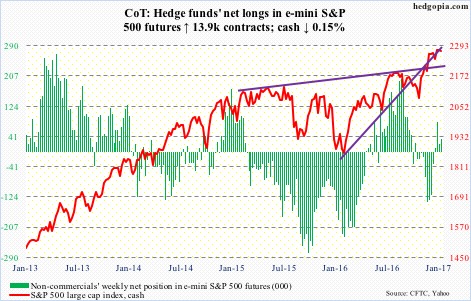
E-mini S&P 500: SPY, the SPDR S&P 500 ETF, lost another $2.3 billion in the week through Wednesday. This comes on the heels of outflows of $4.5 billion in the prior week (courtesy of ETF.com).
The cash has gone sideways for five weeks, with a weekly doji this week plus a back-to-back inside week. This was preceded by a quick 6.6-percent rally post-November 8 election.
In essence, the S&P 50 could just be consolidating before another leg higher or is just tired. It is probably the latter.
Outflows at this juncture do not help. This can feed on itself. From November 9 through this Wednesday, $16.2 billion moved into SPY. There is decent amount of money waiting to lock in post-election gains.
Also in the week ended Wednesday, $3.1 billion left U.S.-based equity funds. This followed inflows of $16.6 billion in the prior three (courtesy of Lipper).
Currently net long 35.3k, up 13.9k.
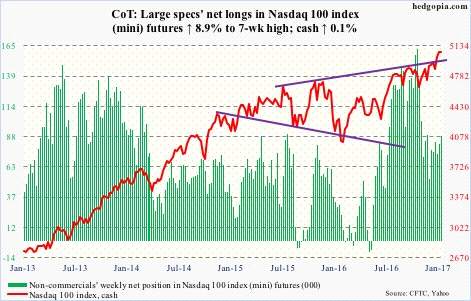
Nasdaq 100 index (mini): Year-to-date on a relative basis, tech has done much better, with the Nasdaq 100 up 4.1 percent, versus the S&P 500 up 1.5 percent and the Russell 2000 down 0.4 percent. This is also reflected in flows.
Through Wednesday, QQQ, the PowerShares Nasdaq 100 ETF, took in $160 million, versus outflows of $4.8 billion for SPY and $269 million for IWM, the iShares Russell 2000 ETF (courtesy of ETF.com).
In the latest week, QQQ attracted $245 million, preceded by $642 million in inflows in the prior week.
Some signs of fatigue are beginning to show up on the cash’s daily chart. Bears first need to be able to take out shorter-term moving averages, which are still rising. Bulls in the meantime have forged decent support at 4990, and then 4900.
Currently net long 89k, up 7.3k.
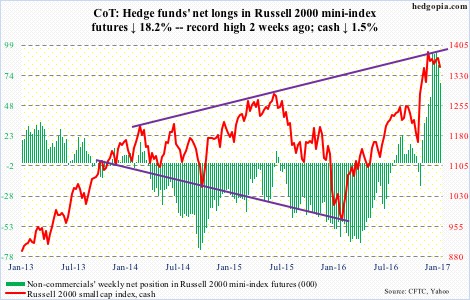
Russell 2000 mini-index: No sooner than the 10- and 20-day moving averages were reclaimed (Friday last week) than they were lost again. The cash opened the week down 1.4 percent, and by Thursday proceeded to test the 50-day moving average, which held. For now.
One can argue the Russell 2000 has been correcting through time, rather than price. It has essentially gone sideways for the last six weeks.
Here is another way to look at this. When the index peaked on December 9 at 1392.71, the 50-day moving average lied at 1260, now it is at 1343.
Looking at recent trend in flows, it is probably only a matter of time before the 50-day is lost. In the week ended Wednesday, IWM lost $331 million, following outflows of $60 million in the prior week. In the prior four weeks, it took in $1.7 billion.
Non-commercials’ sizable net longs remain the biggest wildcard. Having caught the post-election rally spot-on, they must be very tempted to lock in profit. Net longs did go down this week.
Currently net long 67.4k, down 15k.
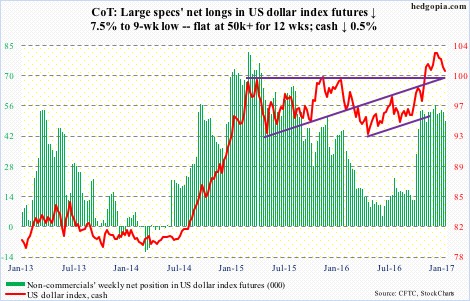
US Dollar Index: History was made this week. Sort of. The cash dropped 0.9 percent on Tuesday responding to President-elect Donald Trump’s statement he made to the Wall Street Journal on Friday last week that the strong dollar was killing U.S. companies’ ability to compete.
Dollar bulls were already struggling to save last November’s breakout. The president-elect’s comments did not help. On Tuesday, the dollar index sliced through its 50-day moving average, and an attempt to reclaim the average in the following threee sessions failed.
That said, the cash is oversold on a daily basis. The area of interest remains 102. Inability to rally past this support-turned-resistance increases the odds that overbought weekly conditions continue to get unwound.
A rising trend line drawn from the May 2016 low gets tested around 98.
Currently net long 49.1k, down 4k.
VIX: On the cash, the 50-day moving average, which resisted a rally attempt on Thursday, is rapidly dropping. Here is the thing, though. With the average at 12.68, and solid support in the 11-12 range on the cash, how long before that average gets convincingly taken out? It probably happens soon.
The VIX-to-VXV ratio, by the way, after remaining stuck in the high .70s in six of the prior eight weeks, inched up to .8 this week. There is a long way to go before the ratio gets overbought.
Amidst this, non-commercials are net short VIX futures up to the gills – a hair’s breadth away from the record high last September. Unwinding of these will not be pretty.
Currently net short 132.4k, up 6.2k.
http://www.hedgopia.com/cot-peek-into-future-through-futures-79/
• DiscoverGold
Click on "In reply to", for Authors past commentaries
* January 21, 2017
Following futures positions of non-commercials are as of January 17, 2017.
E-mini S&P 500: SPY, the SPDR S&P 500 ETF, lost another $2.3 billion in the week through Wednesday. This comes on the heels of outflows of $4.5 billion in the prior week (courtesy of ETF.com).
The cash has gone sideways for five weeks, with a weekly doji this week plus a back-to-back inside week. This was preceded by a quick 6.6-percent rally post-November 8 election.
In essence, the S&P 50 could just be consolidating before another leg higher or is just tired. It is probably the latter.
Outflows at this juncture do not help. This can feed on itself. From November 9 through this Wednesday, $16.2 billion moved into SPY. There is decent amount of money waiting to lock in post-election gains.
Also in the week ended Wednesday, $3.1 billion left U.S.-based equity funds. This followed inflows of $16.6 billion in the prior three (courtesy of Lipper).
Currently net long 35.3k, up 13.9k.

Nasdaq 100 index (mini): Year-to-date on a relative basis, tech has done much better, with the Nasdaq 100 up 4.1 percent, versus the S&P 500 up 1.5 percent and the Russell 2000 down 0.4 percent. This is also reflected in flows.
Through Wednesday, QQQ, the PowerShares Nasdaq 100 ETF, took in $160 million, versus outflows of $4.8 billion for SPY and $269 million for IWM, the iShares Russell 2000 ETF (courtesy of ETF.com).
In the latest week, QQQ attracted $245 million, preceded by $642 million in inflows in the prior week.
Some signs of fatigue are beginning to show up on the cash’s daily chart. Bears first need to be able to take out shorter-term moving averages, which are still rising. Bulls in the meantime have forged decent support at 4990, and then 4900.
Currently net long 89k, up 7.3k.

Russell 2000 mini-index: No sooner than the 10- and 20-day moving averages were reclaimed (Friday last week) than they were lost again. The cash opened the week down 1.4 percent, and by Thursday proceeded to test the 50-day moving average, which held. For now.
One can argue the Russell 2000 has been correcting through time, rather than price. It has essentially gone sideways for the last six weeks.
Here is another way to look at this. When the index peaked on December 9 at 1392.71, the 50-day moving average lied at 1260, now it is at 1343.
Looking at recent trend in flows, it is probably only a matter of time before the 50-day is lost. In the week ended Wednesday, IWM lost $331 million, following outflows of $60 million in the prior week. In the prior four weeks, it took in $1.7 billion.
Non-commercials’ sizable net longs remain the biggest wildcard. Having caught the post-election rally spot-on, they must be very tempted to lock in profit. Net longs did go down this week.
Currently net long 67.4k, down 15k.

US Dollar Index: History was made this week. Sort of. The cash dropped 0.9 percent on Tuesday responding to President-elect Donald Trump’s statement he made to the Wall Street Journal on Friday last week that the strong dollar was killing U.S. companies’ ability to compete.
Dollar bulls were already struggling to save last November’s breakout. The president-elect’s comments did not help. On Tuesday, the dollar index sliced through its 50-day moving average, and an attempt to reclaim the average in the following threee sessions failed.
That said, the cash is oversold on a daily basis. The area of interest remains 102. Inability to rally past this support-turned-resistance increases the odds that overbought weekly conditions continue to get unwound.
A rising trend line drawn from the May 2016 low gets tested around 98.
Currently net long 49.1k, down 4k.

VIX: On the cash, the 50-day moving average, which resisted a rally attempt on Thursday, is rapidly dropping. Here is the thing, though. With the average at 12.68, and solid support in the 11-12 range on the cash, how long before that average gets convincingly taken out? It probably happens soon.
The VIX-to-VXV ratio, by the way, after remaining stuck in the high .70s in six of the prior eight weeks, inched up to .8 this week. There is a long way to go before the ratio gets overbought.
Amidst this, non-commercials are net short VIX futures up to the gills – a hair’s breadth away from the record high last September. Unwinding of these will not be pretty.
Currently net short 132.4k, up 6.2k.
http://www.hedgopia.com/cot-peek-into-future-through-futures-79/
• DiscoverGold
Click on "In reply to", for Authors past commentaries
Information posted to this board is not meant to suggest any specific action, but to point out the technical signs that can help our readers make their own specific decisions. Your Due Dilegence is a must!
• DiscoverGold
Join the InvestorsHub Community
Register for free to join our community of investors and share your ideas. You will also get access to streaming quotes, interactive charts, trades, portfolio, live options flow and more tools.

