5 Boring Uptrends in 5 Exciting Stocks By Arthur Hill
* January 21, 2017
One would normally not consider Facebook, Alphabet, Apple, Amazon and Microsoft boring. Well, maybe Microsoft. All joking aside, these tech titans are the biggest stocks in the Nasdaq 100 ETF (QQQ) and they account for around 40% of the ETF. This means traders or investors in QQQ best follow these five charts closely. These titans also account for around 13% of the S&P 500 SPDR, which is yet another reason to make these charts part of your routine.
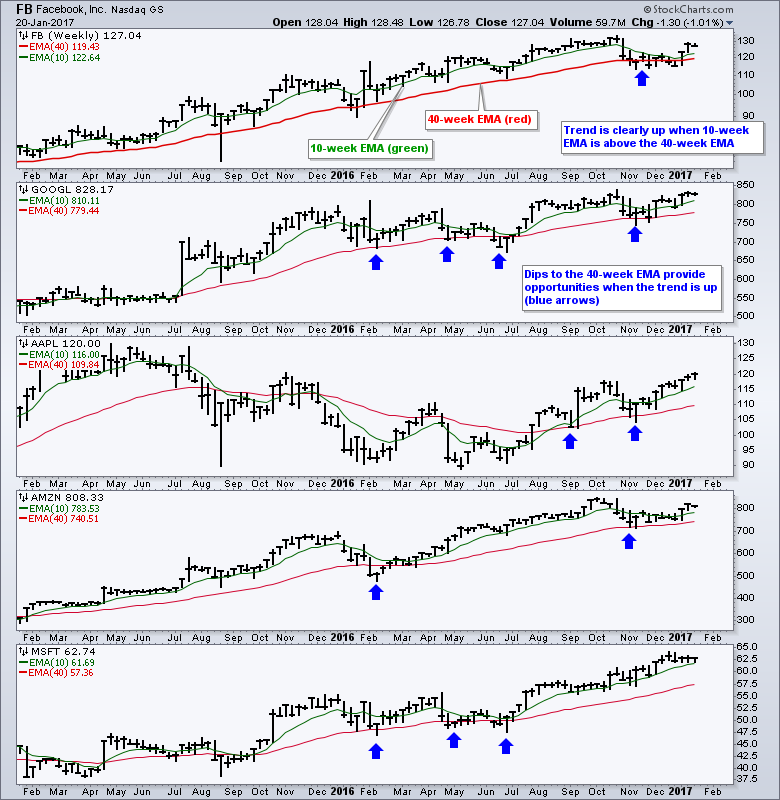
While their businesses are certainly not boring, their long-term charts are quite boring. And this can be a good thing. The chart below shows each stock with the 10-week EMA in green and the 40-week EMA in red, which are similar to the 50-day EMA and 200-day EMA. The trend is up when the 10-week is above the 40-week, and down otherwise. The Fab Five been in uptrends since August 2016. Facebook sports the longest uptrend with a bullish EMA cross in July 2013 - over three and a half years ago. The rest are as follows: Amazon since February 2015, Alphabet since June 2015, Microsoft since October 2015 and Apple since August 2016. These uptrends support the long-term uptrend in QQQ, which has been in an uptrend since March 2016. Even though these trends will not last forever, we need to be aware of these trends and capture a few big trends for profitable investing.
Identifying a trend is one thing. Catching a ride during an uptrend is another. This is where is pays to follow boring uptrends. Chartists should not remove a stock from their watch-list just because it is at a new 52-week high and seemingly overbought. Stocks in uptrends should remain on our watch-list so we can identify pullbacks and opportunities when they occur. The depth of the pullback depends on your trading style. Some chartists can use daily charts and look for short-term oversold readings in 10-day RSI or 20-day CCI. Others may use weekly charts and wait for a dip below the 40-week EMA - or even the 10-week EMA. The takeaway here: a dip within an uptrend is usually an opportunity, not a threat to the uptrend.
**************************************** Thanks for tuning in and have a good weekend! --Arthur Hill CMT
Information posted to this board is not meant to suggest any specific action, but to point out the technical signs that can help our readers make their own specific decisions. Your Due Dilegence is a must! • DiscoverGold
Register for free to join our community of investors and share your ideas. You will also get access to streaming quotes, interactive charts, trades, portfolio, live options flow and more tools.


 News
News  Market Data
  Discover