


Friday, December 30, 2016 9:31:55 AM
With rising volume on everything below so negative, there's only two guesses to make. We've bottomed and will shortly begin moving higher again or we've got more down to go. My take is the latter as there's nothing in the fundamentals to justify a reversal and I think there's no real long investors in the market. If it is only MMs, shorters, day traders, ... there's nothing there to counter the MMs' bias to push price lower as that's the easiest path to their profits.
So I remain near-term negative.
Open high, quick short dip, move up to make the day's high by 10:01 and then a drop, flat, drop, flat with falling highs, drop to make the low by ~14:20, flat until ~15:15, and then a small push up to close at $0.7165. Needless to say, a breakdown is confirmed.
The west coasties seemed to have been in the market today, but appeared later than normal, so maybe it wasn't them at all. The support quantities also didn't seem as large or as static as most times and there was no appearance of trying to push price up.
There were no pre-market trades.
09:30-10:01 opened the day with a 10,165 buy for $0.75 & $0.738 x 80 (odd lot). Price started moving up relatively quickly, doing 9:31's 450 $0.7391, 9:32's b/a of 213:1.2K $0.7360/99, 9:36's 800 $0.7380/$0.7400/4, 9:37's 120 $0.7450, 9:38's 120 $0.7450, 9:39's b/a 211:5.1K $0.7450/$0.75, 9:41's 3.1K $0.7450/$0.75, 9:42's 100 $0.75, 9:44's 2.8K $0.7471, 9:45's 2.3K $0.75, 9:47's b/a 100:2.6K $0.7401/$0.75, 9:54's 200 $0.7492, 9:56's 4.3K $0.7499/$0.7500 (~2.7K)/11 (250), 9:58's b/a 4K:75 $0.7510/50 (offer backed by presented 6.6K $0.76), 9:59's 4.2K $0.7510, and the period ended on 10:01's 1.6K $0.7555 (1.5K)/10.
10:02-10:42 began with 10:02's b/a at 500:1K $0.7480/$0.7509. After three no-trades minutes a mostly extremely low/no-volume drop began from 10:05's 925 $0.7505/01 (725). 10:06's 500 hit $0.75, 10:13's b/a was 2.3K:1.8K $0.74/5, 10:17's 500 hit $0.7448, 10:20's 100 hit $0.7411, 10:23's b/a was 500:900 $0.7470/99, 10:23's 10.6K hit $0.7470/60/40/00, 10:27's 2.6K hit $0.74/$0.7360/00, 10:29's b/a was 1.8K:100 $0.73/$0.7447, 10:28-:29 rose doing 130/100 $0.7378/$0.7447 but 19:33-:34 fell right back doing 290/400 $0.7430/23/00/$0.73, 10:37's b/a was 1.1K:200 $0.7310/$0.7446. The period ended on 10:42's 820 $7398/00.
10:43-11:25, after two no-trades minutes, began extremely low/no-volume $0.7300/98 with falling highs on 10:45's 200 $0.7300. B/a at 10:47 was 1.2K:2.5K $0.7300/99, 11:02 3.8K:1.3K $0.7300/97, 11:17 3.9K:3.6K $0.7300/96. The period ended on 11:25's 190
$0.7342.
11:26-11:40 began extremely low/no-volume $0.7201/7 after 11:26-:27's 12.5K $0.7350/00/$0.7250/$0.7300/$0.7250/13/10. B/a at 11:32 was 1.2K:1K $0.7201/97. Volume and price were interrupted by 11:38's 13.9K $0.7210/02/05/02/05. B/a at 11:40 was 100:1.2K $0.7202/97. The period ended on 11:40's 180 $0.7202.
11:41-14:19 began extremely low/no-volume $0.7212/99 with a slowly falling range after 11:43's 20.5K $0.7250/90/50/97/$0.7300/1/2/6/$0.74 12.3K blk trade/$0.7215/12/15. B/a at 11:51 was 100:1.3K $0.7212/99, 12:04 500:1.4K $0.7212/$0.7298. Volume was interrupted by 12:15's 6.3K $0.7296 (5.5K)/12 and volume switched to variable no/low/medium/high through 12:27.
Then it went back to extremelylow/no-volume. That also opened the range again to $0.7200/96. B/a at 12:18 was 200:2.3K $0.7212/96. 12:20's 7.2K hit $0.7225/12/19/12/10/02/00. Range expanded again to $0.7200/96, but with falling highs. B/a at 12:24 was 250:2.4K $0.7212/96, 12:32 300:1.1K $0.7210/95, 12:40 4.8K:4.8K $0.7211/52. Range highs were down to $0.725x by 12:40. Volume was interrupted by 12:44's 8K $0.7252/17/23/11/23/28/11. B/a at 12:47 was 900:5K $0.7211/52. Volume was again interrupted by 12:48's 11.1K $0.7211/10/00.
B/a at 12:50 was 24K:2.1K $0.7200/52 (west coasties arrive late?), 13:02 23.3K:600 $0.7200/51, 13:16 14:3K:2.3K $0.7200/47, 13:33 27.2K:50 $0.7200/36 (offer backed by presented 3.6K $0.7245). Range highs were $0.722x by ~13:40 and $0.714x by 14:05. B/a at 14:10 was 6.9K:1.6K $0.7200/08, 14:17 1.4k:49 $0.7200/7202 (offer backed by presented 1.8K $0.7203). The period ended on 14:19's 949 $0.72.
14:20-15:14 began by banging the highs down, with low volume, after 14:20's 19.3K $0.7200 (incl 11K blk trd)/$0.7195/90/00/$0.7200/$0.7100/03/00/97/00/94/00, and through 14:27. B/a at 14:22 was 44.7K:2.6K $0.7100/84. Then began mostly very low-volume $0.7100/10, but for an early 2K $0.7138 at 14:38. B/a at 14:31 was 41.6K:1.7K $0.7100/44. Volume was interrupted by 14:35's ~48.6K (incl. 30.9K $0.7100 and 9K $0.7102 blk trades) $0.7102/00/01/00/01/00. B/a at 14:39 was 35K:1.5K $0.7100/37. By 14:43 highs were $0.7102. B/a at 14:48 was 11.5K:1.6K $0.7100/01, 15:02 10.7K:250 $0.7100/02. Price was interrupted by 15:10's 900 $0.7104/19. The period ended on 15:14's 100 $0.7104.
15:15-16:00 began raising the range on 15:15's 452 $0.7105/88, 15:17's 400 $0.7103/04/50, 15:18's b/a 1K:2.2K $0.7103/99, 15:19's b/a 1.4K:1.4K $0.7150/99, 15:22's 10.8K $0.7175/99/$0.72/$0.7170/$0.72/$0.7175/51/50, 15:24's b/a 671:1.6K $0.7160/99, 15:32's 10.4K $0.7171/$0.7253/00/$0.7172/$0.7201/$0.7172/94/99/$0.7200/01/52, 15:32's b/a 700:200 $0.7150/94. Then began very low-volume $0.7170/83 through 15:43. 15:54 began rising-volume $0.717/$0.7252 with falling highs bottoming on 15:56's 1K $0.7182/41. The period and day ended on 15:59's 25.2K $0.7182/3/2/0/1/0/2/0/2/1/0/ ... 1/3/0/$0.7245/$0.7150/1/0/1 ... and 16:00's 100 $0.7165.
There were no AH trades.
Including the opening trade (closing didn't qualify), there were 23 larger trades (>=5K & 2 4K+) totaling 195,430, 40.77% of day's volume, with a $0.7206 VWAP. Excluding the opening trade, there were 22 larger trades totaling 190,930, 39.83% of day's volume, with a $0.7205 VWAP. For the day's trade volume the count seems higher than normal. This is also seen in percentages of day's volume being excessively high. In a bull market this might be normal though. Are we in a bull market? Not according to the buy percentages (see below).
Interesting that ~59% of days volume also had the lowest VWAPs of the arbitrary periods. Not so interesting, but certainly notable, is that they also had the lowest buy percentages. You can see the front part of the usual pattern here, open high and sink, but the other normal pattens, recover some, flat, drop or rise, flat, ... and do something into the close, are missing. We did get two flats though when you watch by the minute as do I. One had a flat bottom with falling highs, roughly 11:45-14:18, followed by a really nasty drop, and the other just a flat and very narrow range, roughly 14:28-15:14, followed by a rise into the close. The rise wasn't all that though, going from ~$0.7104 to $0.7253 at it's top. Remember we started the day hitting $0.7555 at 10:01.
 Ending  Period  Period  Period __Per. Trade_ Period_ % Day_ Per. End
 Period  Volume     Low    High _Dollar Val._ VWAP___ Volume Buy ~%
  10:01   28670 $0.7380 $0.7555    $21,489.99 $0.7496  5.98% 62.49% Incl 09:30 $0.7500 10,165
  10:42   21422 $0.7300 $0.7505    $15,855.78 $0.7402  4.47% 44.54%
  11:25    6596 $0.7300 $0.7398     $4,845.65 $0.7346  1.38% 46.97%
  11:40   30736 $0.7200 $0.7350    $22,268.94 $0.7245  6.41% 35.21% Incl 11:38 $0.7202 6,000 $0.7210 6,000
  14:19  158086 $0.7200 $0.7400   $114,345.41 $0.7233 32.98% 33.01% Incl 11:43 $0.7400 12,300 12:15 $0.7296 5,500
                                                                         12:27 $0.7200 7,900 12:48 8,600
                                                                         12:57 $0.7252 4,500 12:58 $0.7251 5,000
                                                                         13:39 $0.7201 6,500 13:53 $0.7200 8,100
  15:14  128973 $0.7100 $0.7200    $91,772.74 $0.7116 26.90% 28.65% Incl 14:20 $0.7200 11,000
  16:00   95839 $0.7103 $0.7253    $68,996.96 $0.7199 19.99% 32.00% 14:35 $0.7100 30,900 14:35 $0.7102 9,000
                                                                         14:44 $0.7100 6,750 10,300 $0.7102 4,975
                                                                         15:22 $0.7200 5,670 15:32 $0.7253 6,570
                                                                         15:51 $0.7243 7,200 8,800
                                                                         15:58 $0.7183 6,000 15:59 $0.7182 7,700
On the traditional TA front, movements were:
I've been resisting the urge, but I've just got to say it now - The beat goes on.__Open_ ___Low_ __High_ _Close_ Volume_
Today 0.00% -3.53% -1.18% -3.18% 11.24%
Prior -1.32% -1.87% -1.48% -1.37% -1.43%
Time for a new minimal chart.
On my minimal chart, yesterday I said { But all is not lost - we need a second close below to confirm a breakdown. The west coasties seemed to have been absent today and the support they normally provided was missing. If they come back tomorrow maybe we won't confirm the breakdown. }
All is lost.
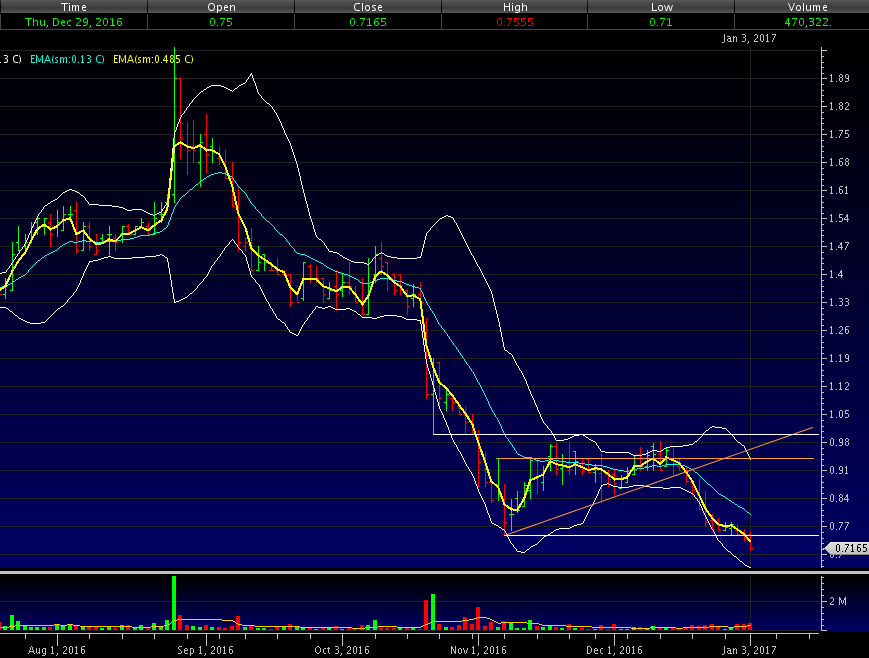
Today confirmed the breakdown with a close below $0.75, down another 3.18% from yesterdays down 1.37%, and on volume rising 11.24%. The rising volume suggests strength in the move lower and there's likely a bit more downside left.
The fast EMA continued descending for the third consecutive day. The gap up to the slow EMA continues to widen.
The experimental 13-period Bollinger limits, which looked to be reducing the rate of divergence and were visually near parallel in moving lower, are still descending and have begun to converge as the upper limit falls more quickly than the lower limit.
On my one-year chart all the SMAs continue to decline.
Yesterday the oscillators I watch had weakening in RSI, accumulation/distribution, and ADX-related. Marginal improvement occurred in momentum, Williams %R, and full stochastic. MFI (untrusted by me) was flat as it remained at it's lower bound of 0.
Today we again had weakening in RSI, accumulation/distribution, and ADX-related. Marginal improvement again occurred in momentum and Williams %R, but full stochastic switched from marginal improvement to weakening. MFI (untrusted by me) was flat as it remained at it's lower bound of 0 for the third consecutive day.
The experimental 13-period Bollinger limits, $0.6700 and $0.9393 ($0.6754 and $0.9716 yesterday), stopped diverging and the faster-falling upper limit is causing them to converge.
All in, the intra-day behavior, declining price with no identifiable support below current price, confirmation of a breakdown on rising volume, mixed but still weak oscillators lead to a continued weakness as seeming most likely. As before, one could believe the volume suggests we had a flush and the sinking will cease. I'd really like to buy that but I have to see reducing volume and improvement somewhere, even if just my unconventional stuff before I can even think about that.

Percentages for daily short sales and buys moved in opposite directions again and both are far from the readings needed for me to think the drop is over, much less a rise is near or under way.
The spread expanded to a range which, in a down trend, suggests there's more to go, especially when viewed in light of the intra-day action.
The VWAP's last twenty-four readings held steady for the eighth day at 16 negatives and 8 positives. Change since 11/23 is -$0.1824, -20.17%, and the averages of the rolling 24-day period seen in the last few days (latest first) are now -0.9164%, 0.8671%, -0.7967%, -0.7936%, -0.8037%, -0.7222%, -0.7346%, -0.6354%, -0.0814%, and -0.0607%.
All in, nothing yet suggests the decline is over.
Bill
Join the InvestorsHub Community
Register for free to join our community of investors and share your ideas. You will also get access to streaming quotes, interactive charts, trades, portfolio, live options flow and more tools.

