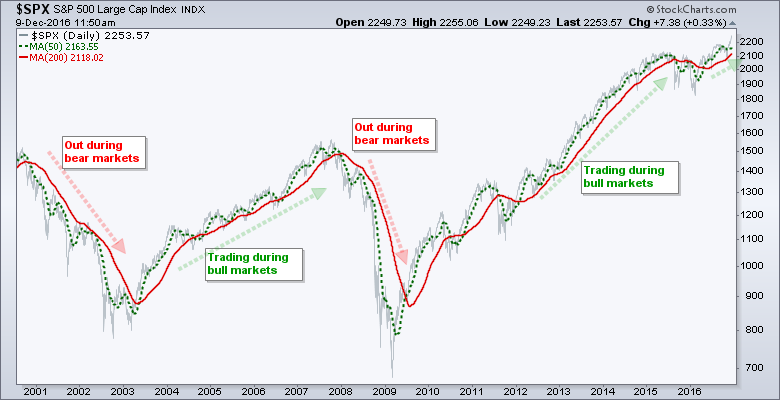
The backtest period extends from 12/01/2000 to 12/01/2016, which covers 16 years of data. I like this testing window because it includes two bear markets, two bull markets and a few periods of extreme volatility. In short, pretty much everything the market can throw at a trader is included.
The system looks for long positions when the 50-day SMA is above the 200-day SMA for the S&P 500 (golden cross). The system does not trade when the 50-day SMA is below the 200-day SMA (death cross). I tested with short positions and it is better to be out of the market when the long-term trend is down.
I am using SPY (the tradable benchmark) and the golden-cross system to compare against these mean-reversion systems. Buy-and-hold for SPY from 12/01/2000 to 12/01/2016 returned 5.22% per annum with a 55% max drawdown. In contrast, the golden cross system returned around 7% per annum with a 20% max drawdown.
System Rules
The testing focuses on SPY, QQQ and IJR with daily data. I am using the S&P SmallCap iShares (IJR) instead of the Russell 2000 iShares (IWM) because IJR has consistently outperformed IWM over the last 16 years. Commissions are $10 per trade and the initial portfolio is $100,000. The signals are based on end-of-day data (closing prices) and the buy-sell prices are based on the next day's open.
Why 5-day RSI and 30/70?
I decided to focus on 5-day RSI because it crosses the 30 and 70 levels quite often. The chart below shows IJR with 5-day, 10-day and 14-day RSI. Notice that RSI(5) crossed the 30/70 thresholds more than 20 times, RSI(10) crossed around 8 times and RSI(14) crossed just 5 times. I also found that the Maximum Drawdowns using RSI(10) and RSI(14) exceeded -20% most of the time. I am using 30/70 to generate signals because these levels are crossed more frequently than 25/75 or 20/80. The drawdowns were generally higher when using the latter levels.
Register for free to join our community of investors and share your ideas. You will also get access to streaming quotes, interactive charts, trades, portfolio, live options flow and more tools.
 News
News  Market Data
  Discover