


| Followers | 679 |
| Posts | 140823 |
| Boards Moderated | 36 |
| Alias Born | 03/10/2004 |
Saturday, December 03, 2016 9:43:31 AM
Peek Into Future Through Futures
* December 3, 2016
Following futures positions of non-commercials are as of November 29, 2016.
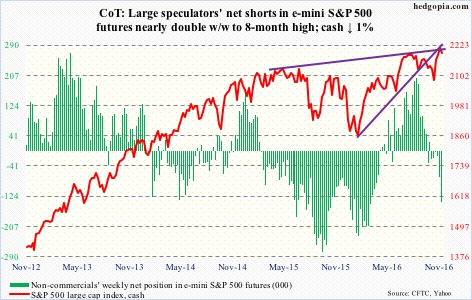
E-mini S&P 500: On Wednesday, post-OPEC decision, the cash rallied to a new all-time high of 2214.1, but was unable to hang on, closing down 0.27 percent. (The Dow Industrials similarly rose to a new all-time high of 19225.29, but closed the session essentially flat at 19123.58, in the process carving out a shooting star.)
The S&P 500 is in the process of unwinding extremely overbought daily conditions. The problem is, if equity bulls do not get their act together, this could wind up dragging the weekly indicators, now in overbought zone, down.
Flows are not helping. In the week ended Wednesday, $1.2 billion was withdrawn from SPY, the SPDR S&P 500 ETF. In the prior week, $2.2 billion was redeemed – which was preceded by two-week inflows of $12.7 billion (courtesy of ETF.com).
Also in the week ended Wednesday, $961 million came out of U.S.-based equity funds (courtesy of Lipper). In the prior three weeks, north of $24 billion came in.
Importantly, the S&P 500 is retreating from dual resistance – the underside of a rising, but broken, trend line from February this year and a slightly rising trend line from May last year.
Currently net short 139.3k, up 68.8k.
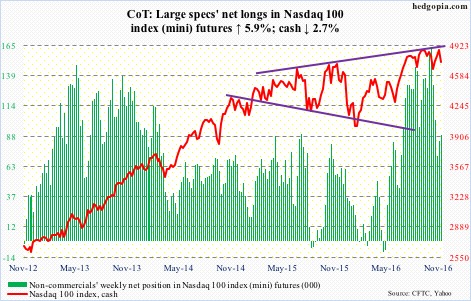
Nasdaq 100 index (mini): On Wednesday, when the S&P 500 and Dow Industrials rose to fresh highs, the Nasdaq 100 never got going, down 1.3 percent.
Large-cap tech has severely lagged the past three weeks. The October 25 all-time high of 4911.76 on the Nasdaq 100 still stands. On Wednesday, it also lost near-term support at 4840 as well as the 50-day moving average.
Support at 4740 is intact. Right around here lies a rising trend line from February this year – a must-hold.
In the week through Wednesday, QQQ, the PowerShares Nasdaq 100 ETF, did attract $220 million. But it is beginning to look like institutions are bailing out. They were not willing to defend 50-DMA.
Currently net long 89.3k, up 5k.
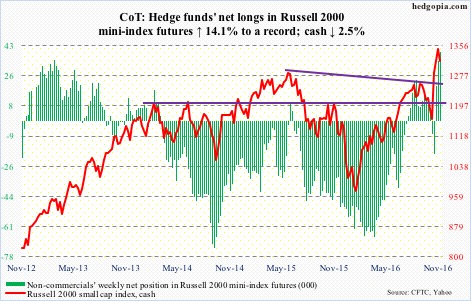
Russell 2000 mini-index: After 15 consecutive up sessions, during which it rallied 16.5 percent (!), the cash began the week with a solid red candle. There is potentially a lot of unwinding left in the days/weeks to come.
Non-commercials, in the meantime, have accumulated record net longs. The Russell 2000 (cash) lost 2.5 percent in the week. These traders’ patience is being tested.
The nearest support lies around 1300 – 1296 was the June 2015 high, which the the index broke out of on November 14. If flows do not cooperate, this potentially gets tested in no time.
In the week ended Wednesday, IWM, the iShares Russell 2000 ETF, lost $210 million. In the prior three, it attracted $6.8 billion (courtesy of ETF.com).
Currently net long 39k, up 4.8k.
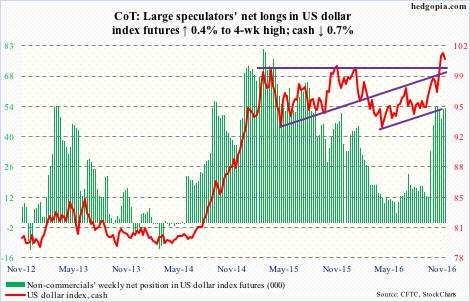
US Dollar Index: Eleven sessions ago, the cash broke out to a 13-year high – past prior two peaks of March and November last year. Since that breakout, the resistance-turned-support has been tested several times already, and closed the week literally on that support.
Dollar bulls have expended lots of energy in rallying the index past 100. Since May this year, it jumped 11 percent.
This will have repercussions for U.S. exports and corporate earnings, among others.
Technically, .618 Fibonacci retracement of the January 2002-March 2008 decline lies at 101.74. Its high last week was 101.97. Plus, non-commercials have pretty much decided to sit out this recent rally. On a daily chart, the dollar index just had a bearish MACD crossover.
It will be awfully difficult to save the afore-mentioned support.
Currently net long 53.4k, up 214.
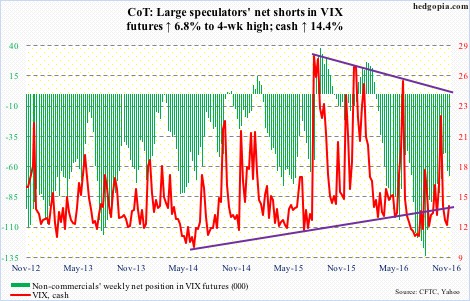
VIX: The VIX-to-VXV ratio began to rise on Wednesday after hitting .794 intraday. Last week, it dropped to .796, which was preceded by .828 in the week before that. These are low readings, and will need to get unwound. The question is, when would that process begin? In the past, the ratio has gone sideways for several more weeks even after dropping into oversold zone.
Spot VIX acts like it wants to push higher, with a bullish MACD crossover on a daily chart. In this scenario, VIX:VXV probably rallies.
Currently net short 67.7k, up 4.3k.
Hedgopia Risk Reward Index
http://www.hedgopia.com/cot-peek-into-future-through-futures-72/
• DiscoverGold
Click on "In reply to", for Authors past commentaries
* December 3, 2016
Following futures positions of non-commercials are as of November 29, 2016.
E-mini S&P 500: On Wednesday, post-OPEC decision, the cash rallied to a new all-time high of 2214.1, but was unable to hang on, closing down 0.27 percent. (The Dow Industrials similarly rose to a new all-time high of 19225.29, but closed the session essentially flat at 19123.58, in the process carving out a shooting star.)
The S&P 500 is in the process of unwinding extremely overbought daily conditions. The problem is, if equity bulls do not get their act together, this could wind up dragging the weekly indicators, now in overbought zone, down.
Flows are not helping. In the week ended Wednesday, $1.2 billion was withdrawn from SPY, the SPDR S&P 500 ETF. In the prior week, $2.2 billion was redeemed – which was preceded by two-week inflows of $12.7 billion (courtesy of ETF.com).
Also in the week ended Wednesday, $961 million came out of U.S.-based equity funds (courtesy of Lipper). In the prior three weeks, north of $24 billion came in.
Importantly, the S&P 500 is retreating from dual resistance – the underside of a rising, but broken, trend line from February this year and a slightly rising trend line from May last year.
Currently net short 139.3k, up 68.8k.

Nasdaq 100 index (mini): On Wednesday, when the S&P 500 and Dow Industrials rose to fresh highs, the Nasdaq 100 never got going, down 1.3 percent.
Large-cap tech has severely lagged the past three weeks. The October 25 all-time high of 4911.76 on the Nasdaq 100 still stands. On Wednesday, it also lost near-term support at 4840 as well as the 50-day moving average.
Support at 4740 is intact. Right around here lies a rising trend line from February this year – a must-hold.
In the week through Wednesday, QQQ, the PowerShares Nasdaq 100 ETF, did attract $220 million. But it is beginning to look like institutions are bailing out. They were not willing to defend 50-DMA.
Currently net long 89.3k, up 5k.

Russell 2000 mini-index: After 15 consecutive up sessions, during which it rallied 16.5 percent (!), the cash began the week with a solid red candle. There is potentially a lot of unwinding left in the days/weeks to come.
Non-commercials, in the meantime, have accumulated record net longs. The Russell 2000 (cash) lost 2.5 percent in the week. These traders’ patience is being tested.
The nearest support lies around 1300 – 1296 was the June 2015 high, which the the index broke out of on November 14. If flows do not cooperate, this potentially gets tested in no time.
In the week ended Wednesday, IWM, the iShares Russell 2000 ETF, lost $210 million. In the prior three, it attracted $6.8 billion (courtesy of ETF.com).
Currently net long 39k, up 4.8k.

US Dollar Index: Eleven sessions ago, the cash broke out to a 13-year high – past prior two peaks of March and November last year. Since that breakout, the resistance-turned-support has been tested several times already, and closed the week literally on that support.
Dollar bulls have expended lots of energy in rallying the index past 100. Since May this year, it jumped 11 percent.
This will have repercussions for U.S. exports and corporate earnings, among others.
Technically, .618 Fibonacci retracement of the January 2002-March 2008 decline lies at 101.74. Its high last week was 101.97. Plus, non-commercials have pretty much decided to sit out this recent rally. On a daily chart, the dollar index just had a bearish MACD crossover.
It will be awfully difficult to save the afore-mentioned support.
Currently net long 53.4k, up 214.

VIX: The VIX-to-VXV ratio began to rise on Wednesday after hitting .794 intraday. Last week, it dropped to .796, which was preceded by .828 in the week before that. These are low readings, and will need to get unwound. The question is, when would that process begin? In the past, the ratio has gone sideways for several more weeks even after dropping into oversold zone.
Spot VIX acts like it wants to push higher, with a bullish MACD crossover on a daily chart. In this scenario, VIX:VXV probably rallies.
Currently net short 67.7k, up 4.3k.

Hedgopia Risk Reward Index
http://www.hedgopia.com/cot-peek-into-future-through-futures-72/
• DiscoverGold
Click on "In reply to", for Authors past commentaries
Information posted to this board is not meant to suggest any specific action, but to point out the technical signs that can help our readers make their own specific decisions. Your Due Dilegence is a must!
• DiscoverGold
Join the InvestorsHub Community
Register for free to join our community of investors and share your ideas. You will also get access to streaming quotes, interactive charts, trades, portfolio, live options flow and more tools.

