


Monday, November 14, 2016 8:27:21 AM
The conventional TA continued showing signs of improvement, especially in the oscillators going from very mixed to most improving. All the signs right now are for consolidation. But a switch from "with a weakening bias, at best" to "with a mild bullish bias". However the falling volume (could be just "Friday effect" though) puts the lie to the switch in bias. Just plain old reversal to start a leg lower continues to be just on the horizon as it is becoming more and more likely that we have indeed topped for the near-term.
My unconventional stuff supports the switch to a "mild bullish bias" scenario but is also suspect due to both the declining volume and my ever-present TFH. The strongest "mild bullish" there is the daily short and buy percentage are both in desirable ranges and the VWAP decline has become less consistent. None of these positive indicators have yet established a trend that encourages confidence though.
The intra-day behavior, in abbreviated form because it's so common, was open low, early push high and plummet, recover around half the drop, go flattish for a large part of the day and then push up near the high into the close.
SOS!
There were no pre-market trades.
09:30-09:52 opened the day with a 459 sell for $0.8820. Then came 9:36's 5.6K $0.88->$0.9198, 9:39's 2.2K $0.9160, 9:40's 100 $0.9145, 9:41's 690 $0.9140/1, 9:42's b/a of 783:644 $0.89/$0.9135, 9:42's 200 $0.9135->$0.9130, 9:43's b/a 783:544 $0.89/$0.9129, 9:43's 1.6K $0.9126/8, 9:50's 420 $0.89->$0.8895->$0.8890->$0.8895, 9:51's 200 $0.8880->$0.8781, and the period ended on 9:52's 12.1K $0.8620/2->$0.8623->$0.8767->$0.8618/21->$0.8618/5.
09:53-10:19 began a very low/no-volume climb on 9:55's 500 $0.8699, hit 10:07s 487 $0.878, 10:19's b/a of 300:1.2K $0.8790/$0.89, and the period ended 10:19's 300 $0.89.
10:20-12:34 began mostly very low/no-volume $0.883/$0.89 (weakened to $0.8899 at 10:38) on 10:20's 1.5K $0.8870 (1.3K)->$0.8845. Volume and/or price were interrupted on 10:29's 5.2K $0.8814/$0.89 and 10:33's 6.2K $0.879/$0.89. B/a at 10:38 was 500:400 $0.8790/$0.8899, 10:47 700:500 $8790/$0.8890. Price was interrupted by 10:50's 3.6K $0.8799/$0.8899. B/a at 11:03 was 600:700 $0.8790/$0.8899. Range began narrowing at 11:42 with rising lows and achieved $0.8867/99 by 11:46. B/a at 11:47 was 900:300 $0.8858/$0.8899, 12:22 400:2K $0.8888/98. The period ended on 12:34's 1.3K $0.8897/8.
12:35-13:10, after one no-trades minute, began extremely low/no-volume $0.8781/$0.8896 on 12:36's ~4.1K $0.8742 (~3.3K)->$0.8896->$0.8803->$0.8896. B/a at 12:38 was 800:1.8K $0.8711/$0.8896, 12:51 1.5K:1.6K $0.8713/$0.8896. The period ended on 13:10's 3K $0.8828-<$0.8781->$0.88.
13:11-13:45 began an extremely low/no-volume rise on 13:11's 13.4K$0.8783/$0.8801, hitting 13:17's 900$0.8787/$0.8896 and having almost no volume thereafter. B/a at 13:37 was 1.7K:200 $0.8867/96. The period ended on 13:45's 700$0.8898.
13:46-14:44 just did a small step up on 13:46's 3.7K $0.8887->$0.8898->$0.89->$0.8909/20 and began [extremely low/no-volume $0.8913/$0.899 with rising lows. B/a at 14:02 was 1.4K:6.8K $0.8948/$0.8990. By 14:13 range narrowed to $0.894/9, 14:19 $0.8955/90, and 14:30 $0.8977/90. The period ended on 14:44's 300 $0.8989/92.
14:45-15:13, after two no-trades minutes, was another minuscule step up on 14:47's 200 $0.8992/$0.90 to begin more extremely low/no-volume $0.8972/$0.90. B/a at 14:48 100:1K $0.8986/$0.90. Volume was interrupted by 14:49's 5.2K $0.8986/$0.90. B/a at 15:05 was 2.1K:900 $0.8944/$0.9000. The period ended on 15:13's 100 $0.90.
15:14-15:33 began a very low-volume rise on 15:14's 1.6K $0.8952/76->$0.90->$0.9086->$0.9050, hit 15:15's 100 $0.91, 15;23's 1K $0.9182, 15:24's 1.1K $0.9037/$0.9191, 15:25's b/a of 3.1K:300 $0.9006/$0.91 (bot moving bid fast), and 15:27's 100 $0.9196, after which it went flat to end the period on 15:33's 100 $0.9191.
15:34-16:00 began low-volume, wide-swing $0.9004/$0.92 on 15:34's 12.3K $0.9150/76->$0.9191->$0.9196 (5.8K)->$0.9099. Volume was interrupted by 15:50's 23.3K $0.9034/$0.9104. The period and day ended on 15:59's 1.2K $0.92->$0.9111->$0.9003->$0.9000->$0.91 and 16:00's 300 $0.91 buy.
Excluding the opening and closing trades (didn't qualify), there were 7 larger trades (>=5K & 2 4K+) totaling 46,351, 19.50% of day's volume, with a $0.8986 VWAP. The count of larger trades seems a bit week for the volume, but that's very subjective. The percentage of day's volume though is no doubt low. There were no "larger larger trades" either. The VWAP is above the day's $0.8926. Looking at the distribution below, it looks likely that this is a result of mostly retail or day traders as most of the larger trades came later in the day with higher VWAPs and buy percentages.
Looking at the volume, VWAP, buy percentage, and low/high changes reveals both the common early push up to an early high and drop big pattern followed by a long flattish period, and the now-common "walking price back up" later in the day. It's more apparent if one examines a minute chart.Ending Period Period Period __Per. Trade_ Period_ % Day_ Per. End
Period Volume Low High _Dollar Val._ VWAP___ Volume Buy ~%
09:52 22346 $0.8615 $0.9198 $19,631.45 $0.8785 9.40% 25.38% Incl 09:52 $0.8615 4,200
10:19 17516 $0.8606 $0.8900 $15,258.10 $0.8711 7.37% 43.55%
12:34 46727 $0.8790 $0.8900 $41,383.47 $0.8856 19.66% 42.87% Incl 10:29 $0.8814 5,000 10:33 $0.8801 4,600
13:10 8989 $0.8742 $0.8896 $7,914.11 $0.8804 3.78% 43.72%
13:45 28118 $0.8767 $0.8898 $24,797.20 $0.8819 11.83% 51.22%
14:44 36219 $0.8887 $0.8992 $32,501.37 $0.8974 15.24% 56.45% Incl 14:07 $0.8989 8,717
15:13 8125 $0.8972 $0.9000 $7,305.62 $0.8992 3.42% 54.82%
15:33 13604 $0.8952 $0.9196 $12,292.92 $0.9036 5.72% 54.98%
16:00 53263 $0.9000 $0.9200 $48,588.19 $0.9122 22.41% 54.05% Incl 15:34 $0.9196 5,800 15:50 $0.9099 9,017
15:50 $0.9100 9,017
On the traditional TA front, movements were:
On my minimal chart I'm going to stick with yesterday's { I may have been just a day or two early - I still think the most likely move will be lower and with the narrowing spread and reducing volume could even occur without touching the resistance. }. I'll also stick with { That latter point seems unlikely though as there has been an obvious and somewhat reliable pattern of pushing the price up in the early trading, ... }. I went on to mention other usual behavior and the uncertainty of the outcomes.__Open_ ___Low_ __High_ _Close_ Volume_
Today -5.67% 0.95% -2.34% 1.20% -25.66%
Prior 8.72% 1.46% -0.31% -3.83% -52.82%
The new rising triangle seems to be still in force and we should expect a move of some kind shortly. I'll remind that possible outcomes include breaking above the resistance and continue seeing the "walking" up continue (until those doing the walking convince the fast money folks it's all real, weakening fundamentals regardless, and the momo folks pile in), formation of a bullish (reverse) short-term head & shoulders patter (indicating a strong rise), and a break below the rising support to start a new down leg within consolidation. This latter case seems most likely but I must not the reliability of the "walking it up" behavior has me doubting that.
The experimental 13-period Bollinger limits continued converging but it's no apparent the upper limit is dropping faster than the lower limit rises, yielding a falling mid-point.
On my one-year chart the four SMAs continue to decline and all will continue to do so unless an unexpected (by me anyway) big rise occurs. However, we now do have the price range above the 10-day SMA for the second consecutive day. If we can hold the close where it's at, or above, the 10-day will begin rising. I'm tired of saying it, and you're probably tired of hearing it, but that would surprise me. Do note however that doubt has begun to creep into my assessment as the "walking it up" folks have been quite successful in maintaining that behavior.
That could be because the shorters have backed off a bit, or even begun doing covering buys, awaiting a more profitable price point (and risk/reward case) or locking in profits before they start hammering again. Unfortunately, the daily short percentage is of little help, usually, in ascertaining if this is the case or not.
The oscillators I watch yesterday were mixed with a few showing weakening and most continuing to show improvement. everything was still below neutral and full stochastic %K was just below overbought.
Today all but ADX-related had small improvement and full stochastic got into overbought. That is the first indication by the oscillators supporting my assessment that we had topped out a couple days back. Momentum and Williams %R got above neutral and the rest remain below neutral. Combined with falling volume this keeps me thinking a very short-term consolidation is in progress before we make the next move. Of course the volume could be a "Friday effect", so we can't get to certain about any of this, especially if we give in credence to my TFH thesis about price getting walked up.
The experimental 13-period Bollinger limits, $0.7432 and $1.3010 ($0.7298 and $1.0659 yesterday) continue converging with a falling mid-point. We are still trading well below the mid-point and sans a move up the mid-point will fall some move, probably until it intersects our trading range.
All in, I'm sticking with we have done a short-term top and are doing a very short-term consolidation. Purely on a TA basis I would continue to expect a re-trace lower within the consolidation next. But I can't bring myself to ignore my TFH which warns that we could see a continued "walking up" of the price range.
Percentages for daily short sales and buys moved in opposite directions, IMO not good, but both are in ranges we would want to see - the short percentage within the lower end of my desired range (needs re-check) and the buy percentage which would yield sustainable appreciation of the buy percentage could hold this range.
The spread narrowed again, this time substantially, and is approaching a range consistent with short-term consolidation. It's still to the high side of that though and was produced by the all-too-common early rise and drop followed by flatness and a rise into the close scenario. This continues to gnaw at me as I strongly suspect the price was being "walked up" and at some point the shorters will see a nice risk/reward (because fundamentals have not changed) and take price down big-time. Adding in the reducing volume (could be "Friday effect" though) I still see no strength in these constant incremental inter-day improvements. So I still think the spread is wide enough to suggest the next big move is lower because we are in a longer-term down trend.
In the past I've been, and will be again, wrong. Sometimes I've been right too.
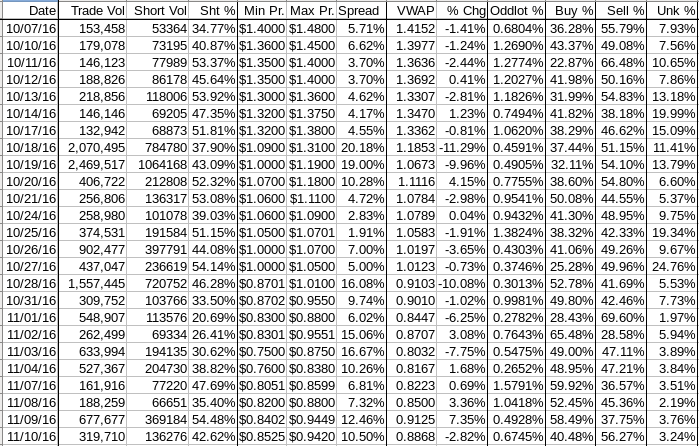
The VWAP's last twenty-four readings improved from 15 negatives and 9 positives to 14 and 10 respectively. Change since 10/10 is -$0.5052, -36.14%, and the averages of the rolling 24-day period seen in the last few days (latest first) are now -1.7433%, -1.8222%, -1.7635%, -1.8877%, -1.8884%, 1.9605%, -2.1754%, -1.7898%, -1.8093%, and -1.5915%.
Well, at least the long VWAP move lower trend is less consistent now. Maybe there's hope.
All in, the short and buy percentage suggest normalization that allows for appreciation. The spread contradicts that for the moment, although it is improving. The VWAP trend lower has become less consistent and and it's behavior seemingly supports short-term consolidation right now. Based solely on this stuff, I would expect short-term consolidation to continue with a mild bullish bias. Adding in my TFH and the conventional chart longer-term trends, this scenario seems less likely though.
Bill
Join the InvestorsHub Community
Register for free to join our community of investors and share your ideas. You will also get access to streaming quotes, interactive charts, trades, portfolio, live options flow and more tools.

